Filipinos in NYC: A Profile
Population
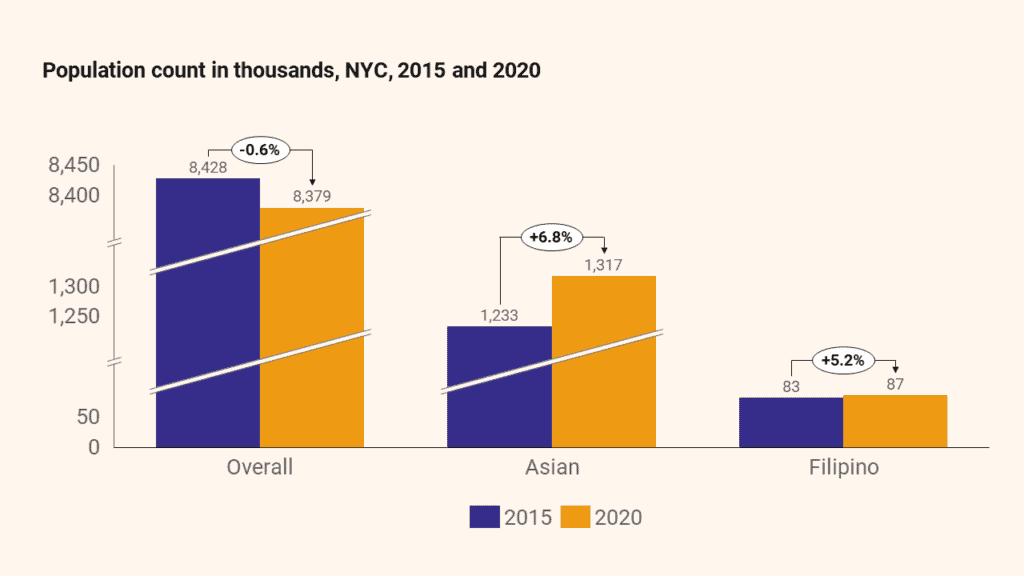
Between 2015 and 2020, the Filipino1 population in NYC grew by 5.2%, a slightly lower rate than the Asian2 population (+6.8%). In contrast, the overall NYC population shrunk by 0.6%.
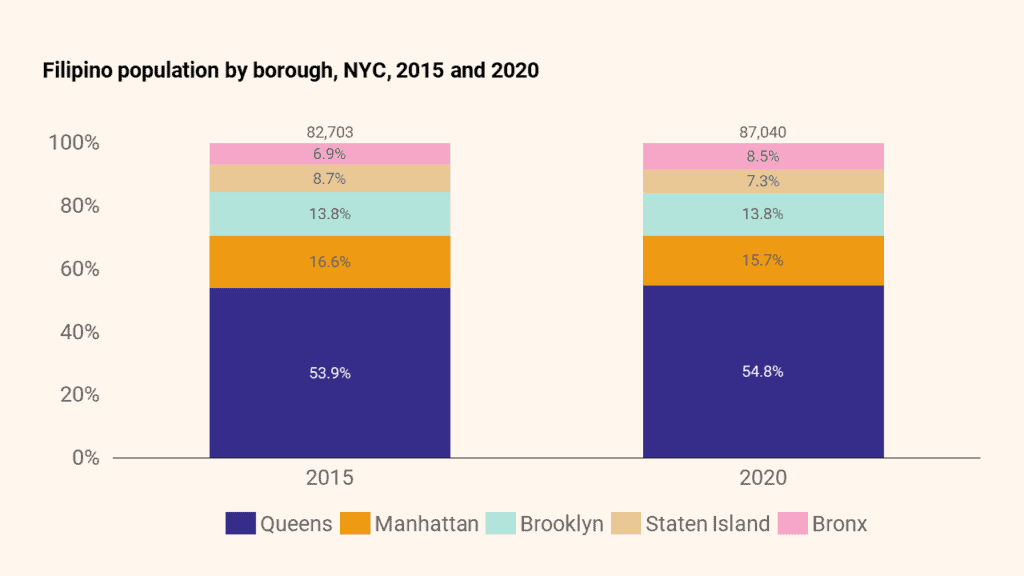
The Filipino population’s residence by borough did not significantly alter between 2015 and 2020. The population’s movement away from Staten Island (-1.5 percentage points) toward the Bronx (+1.6 percentage points) was the most notable change. No other Asian ethnic group has as high a proportion of its population living in Staten Island (7.3%) or as low a proportion living in Brooklyn (13.8%).
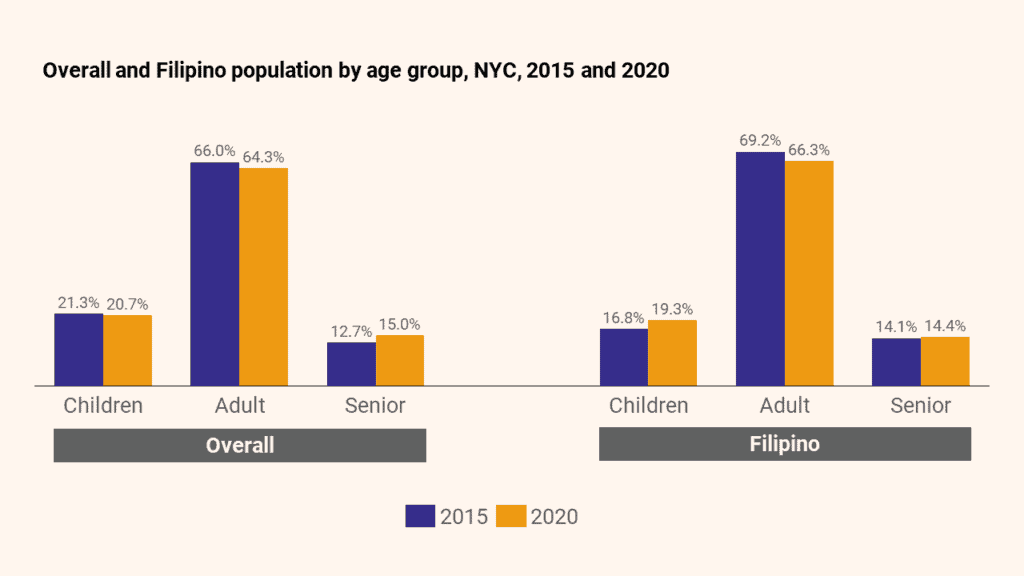
Demographically, the Filipino population in NYC is getting younger. The Filipino population’s share of children under 18 grew by 2.6 percentage points since 2015 (vs. -0.5 in NYC overall), while the adult population declined (-2.8 percentage points) and senior population remained steady (+0.3).
JUMP TO: Population | Immigration, Citizenship, Mobility | Education & English | Income & Poverty | Benefits & Health | Employment | Housing | Technology
Immigration, Citizenship, & Mobility
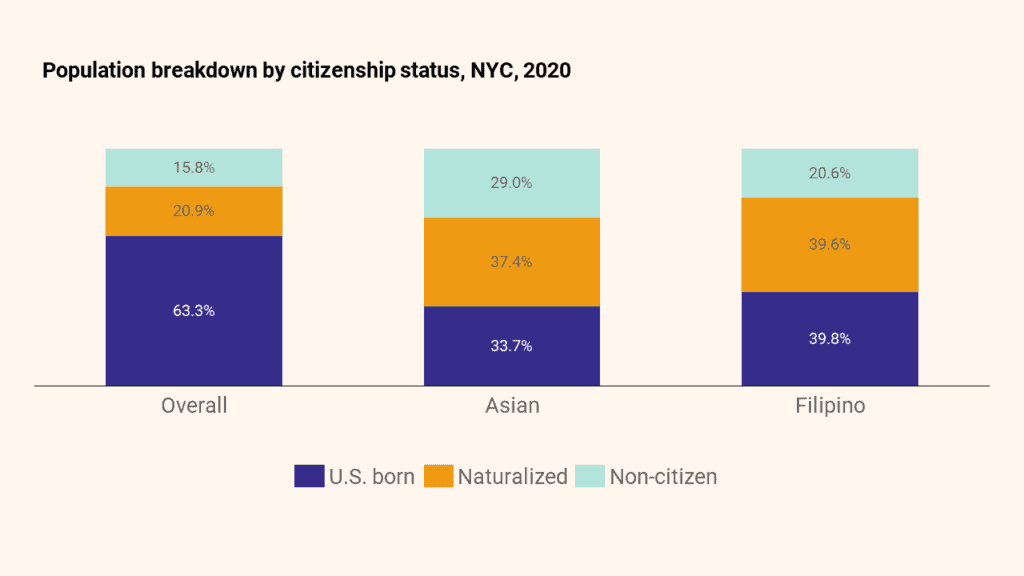
Of the total Filipino population in NYC, 39.8% are US-born, 39.6% are naturalized citizens, and 20.6% are non-citizens. The proportion of Filipinos with U.S. citizenship by birthright has gone up (+5.6 percentage points) while the proportion of non-citizens has gone down (-4.2 percentage points) since 2015. In contrast, most people in NYC became citizens by birthright (63.3%) and naturalization (20.9%). Some 15.8% of New Yorkers are non-citizens.
Only one-third (36.7%) of New Yorkers, in general, are foreign-born, while about two-thirds (60.2%) of Filipino residents are.
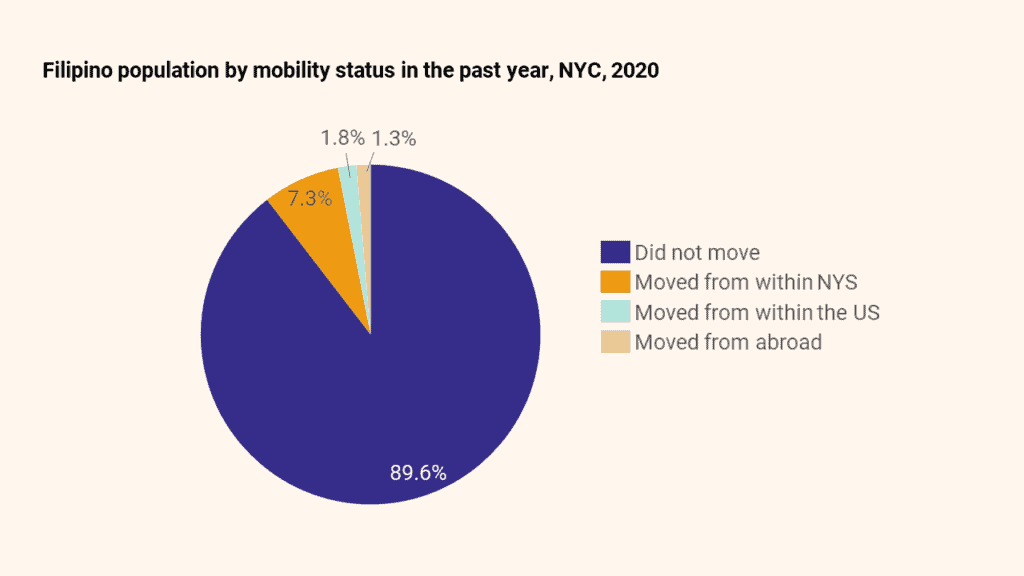
9.1% of foreign-born Filipinos arrived in the City within five years of the survey, in line with the City’s 9.5% estimate. However, only 1.3% of the overall Filipino population had relocated to NYC from abroad within one year of the survey. In comparison, most Filipinos (89.6%) had not moved from their previous residence in the City.
JUMP TO: Population | Immigration, Citizenship, Mobility | Education & English | Income & Poverty | Benefits & Health | Employment | Housing | Technology
Education & English
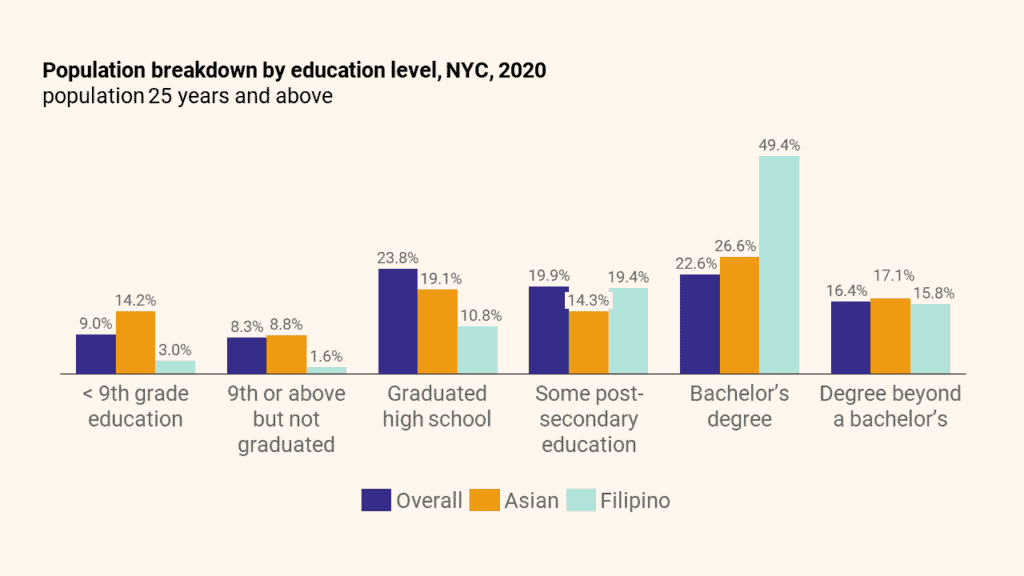
Filipinos are among the most educated Asian ethnic groups. 4.6% of Filipino adults hold less than a high school education and nearly two-thirds (65.2%) hold a bachelor’s degree or higher. This is significantly more educated than the City overall, where 17.3% have less than a high school education and only 39.0% hold a bachelor’s degree or higher. Across Asian ethnic groups, Filipinos have the highest rates of adults with a bachelor’s degree (49.4%).
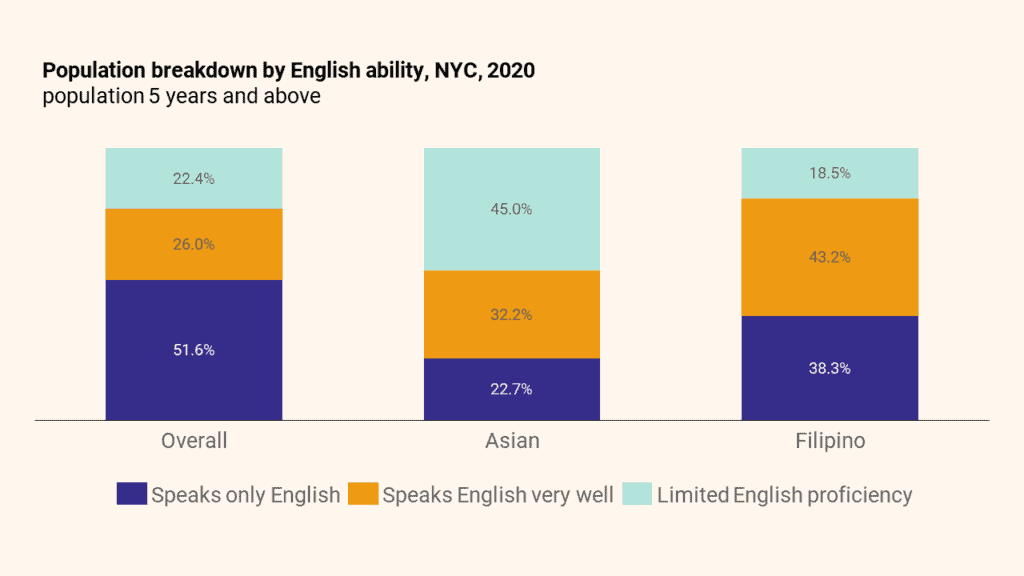
Filipinos also have the highest English proficiency among Asian ethnic groups, with only 18.5% reporting limited English proficiency (LEP) and 43.2% reporting speaking English very well. The Filipino community’s English proficiency levels are more fluent than those of NYC overall, with 18.5% of Filipinos over the age of 5 considered LEP – less than the City’s 22.4% rate.
The LEP rate is lower for Filipino children (5+ but under 18) at 4.2% but higher for Filipino seniors (age 65+) at 38.7%.
JUMP TO: Population | Immigration, Citizenship, Mobility | Education & English | Income & Poverty | Benefits & Health | Employment | Housing | Technology
Income & Poverty
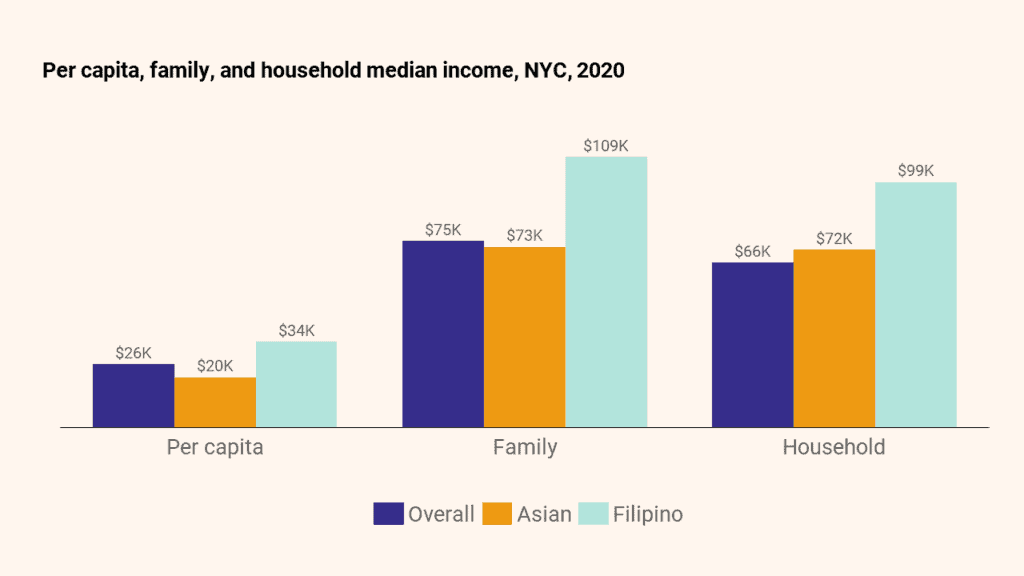
Filipino New Yorkers have above-average per capita, family, and household median incomes compared to City residents overall. Compared to other Asian ethnic groups, Filipinos have above-average per capita median incomes and the highest family and household median incomes.
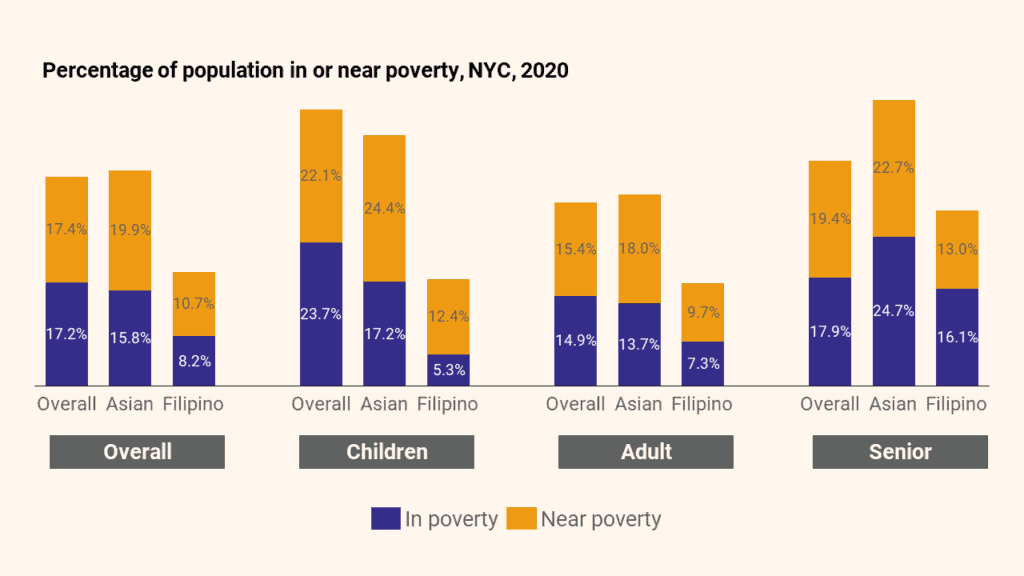
Filipinos have the lowest poverty rates compared to other Asian ethnic groups and are also below-average compared to the City overall.
JUMP TO: Population | Immigration, Citizenship, Mobility | Education & English | Income & Poverty | Benefits & Health | Employment | Housing | Technology
Benefits & Health
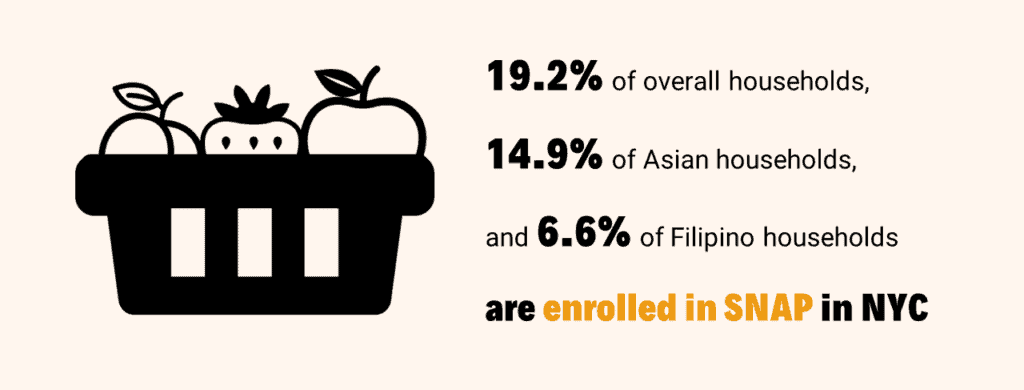
Filipino households3 are enrolled in SNAP at a lower rate than both New York City and Asian households.
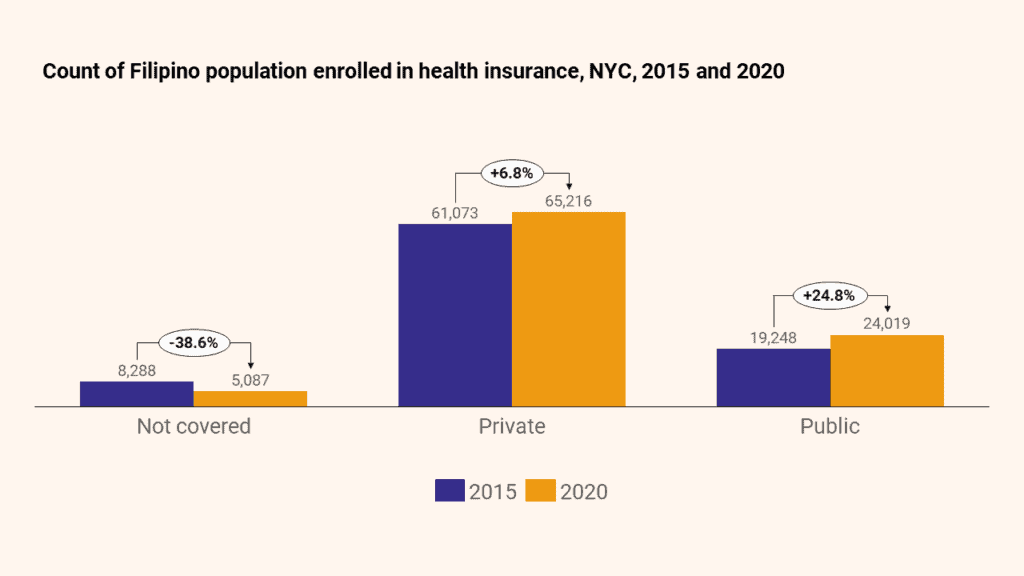
The Affordable Care Act has significantly reduced the number of uninsured in NYC, and the Filipino population is no exception. Between 2015 and 2020, 38.6% fewer Filipino people were uninsured. As a result, only 5.8% of Filipinos are uninsured, three-quarters (74.9%) are enrolled in private insurance, and the remaining are enrolled in public insurance (27.6%).
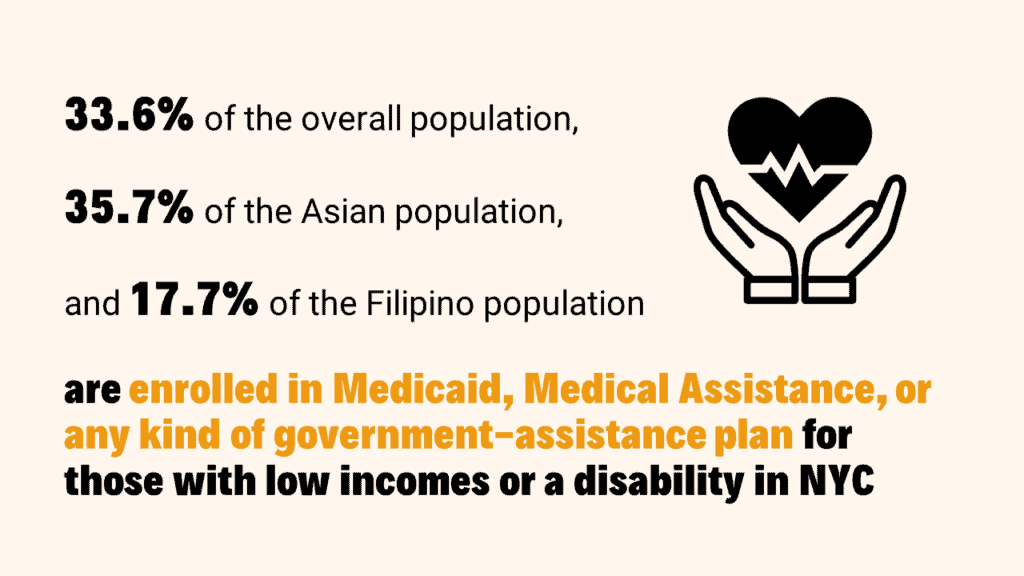
The Filipino population is enrolled in government-assisted health insurance at about half the rate compared to City and Asian populations.
JUMP TO: Population | Immigration, Citizenship, Mobility | Education & English | Income & Poverty | Benefits & Health | Employment | Housing | Technology
Employment
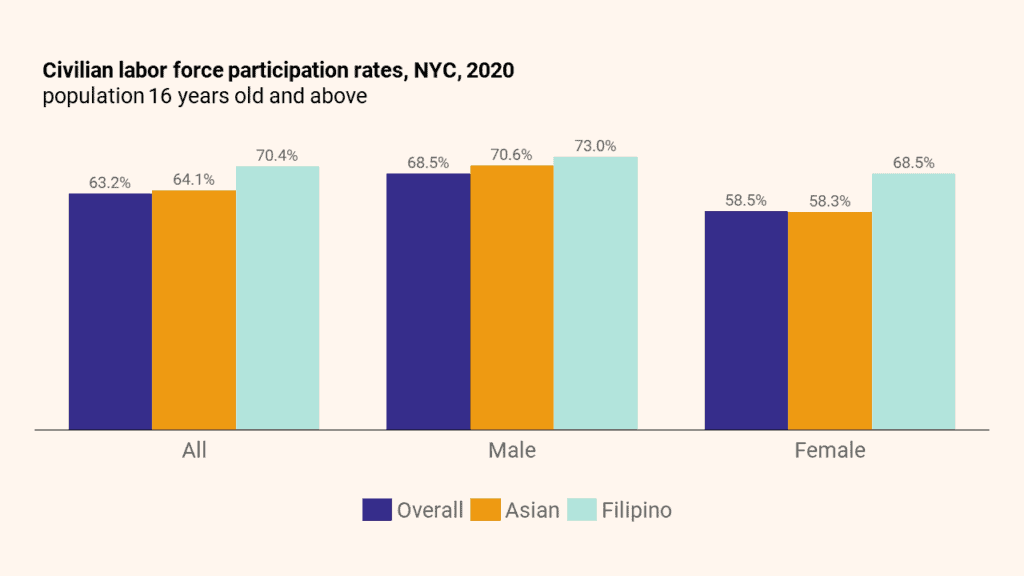
Filipino labor force participation rates are above-average for both male and female workers. Female Filipino workers have the highest labor force participation rates (68.5%) compared to other Asian ethnic groups.
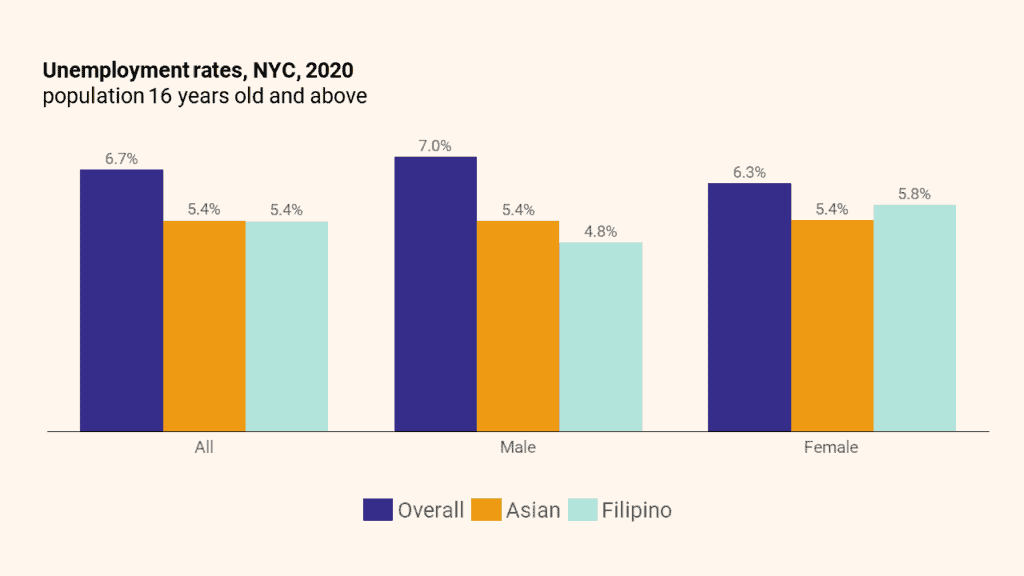
Filipino unemployment rates are lower than City rates; however, they are considered some of the highest among other Asian ethnic groups.
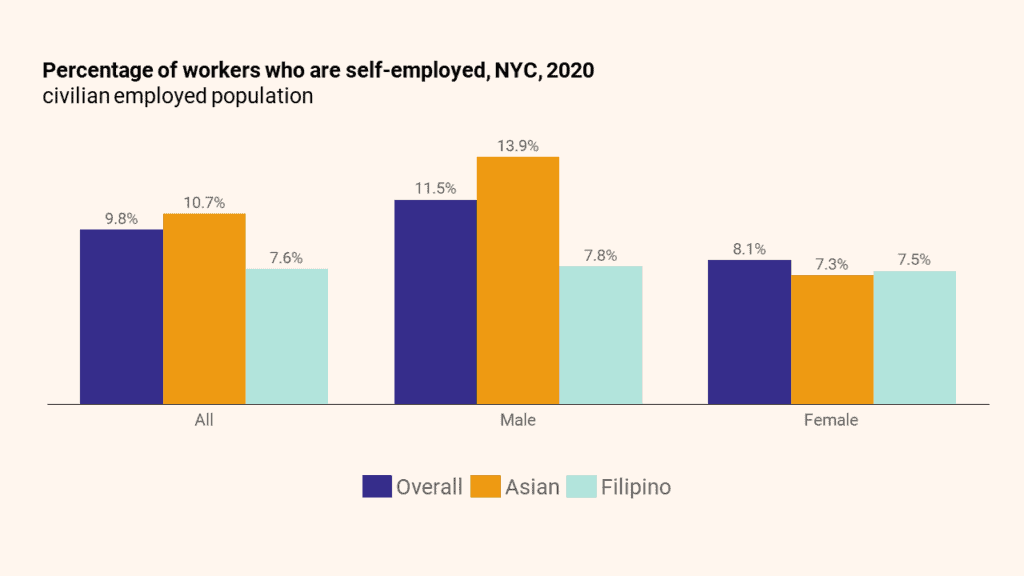
Filipino employees are less likely to be self-employed (7.6%) than both the overall (9.8%) and Asian (10.7%) populations. This self-employment rate is particularly low for male Filipino employees (7.8% compared to the City rate of 11.5% and the Asian rate of 13.9%).
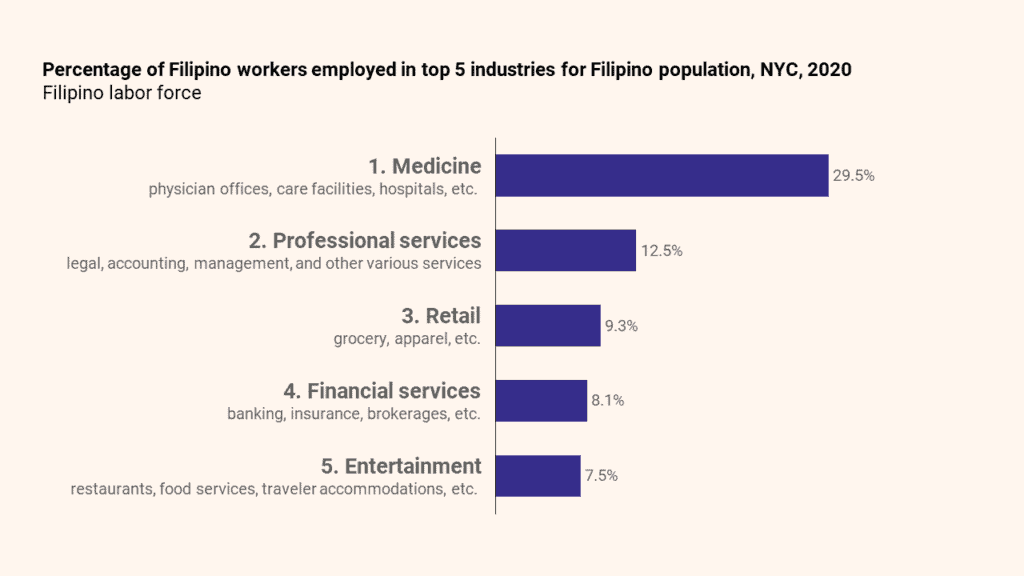
Nearly one-third (29.5%) of the Filipino labor force is employed by the medical industry. Within medicine, 53.9% of Filipinos work in general medical, surgical, and specialty hospitals.
JUMP TO: Population | Immigration, Citizenship, Mobility | Education & English | Income & Poverty | Benefits & Health | Employment | Housing | Technology
Housing
Average household size, NYC, 2015 and 2020
| Household group | 2015 | 2020 |
| Overall | 2.65 | 2.57 |
| Asian | 3.10 | 2.98 |
| Filipino | 3.04 | 2.89 |
Filipino households3 in 2020 had a larger average household size than City households (2.89 people versus 2.57 people). In general, average household sizes have decreased in New York City since 2015, and Filipino households are no exception.
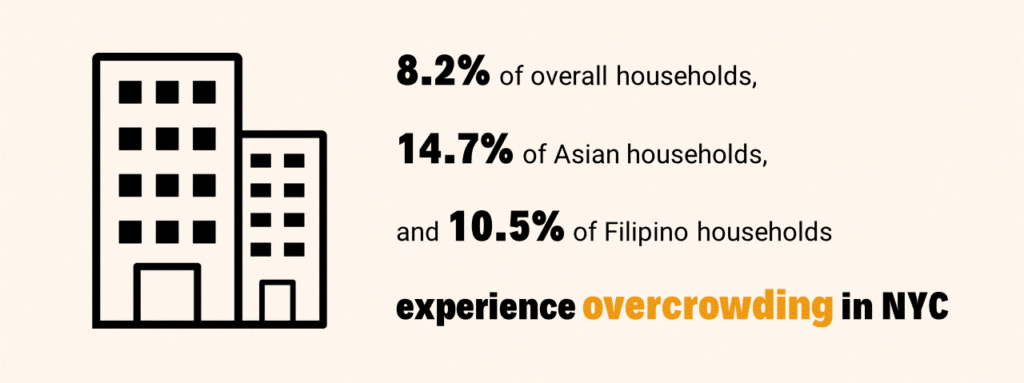
Filipino households3 are overcrowded (10.5%) at a higher rate than City households (8.2%) but at a lower rate than Asian households (14.7%).
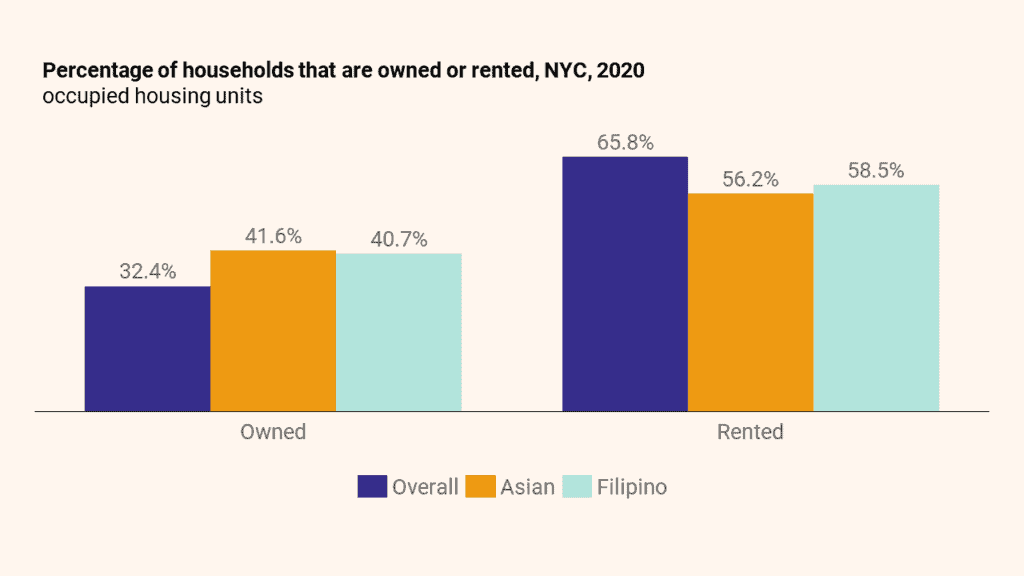
Filipino households3 own their homes at a higher rate and rent at a lower rate than City households. While 32.4% of the City households are owned, 40.7% of Filipino households are owned.
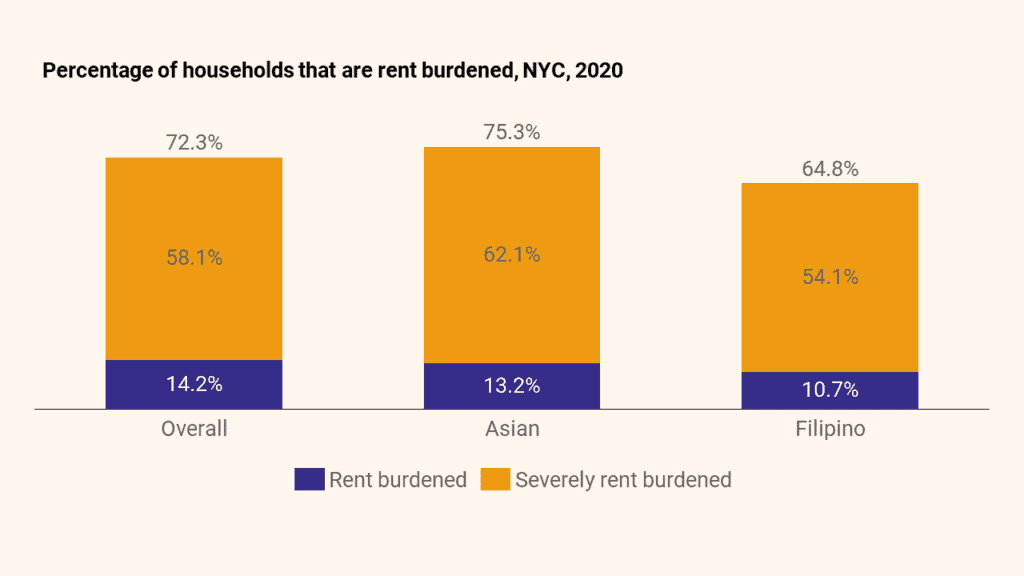
Rented Filipino households3 tend to be severely rent burdened. 64.8% of rented Filipino households are rent burdened in some capacity, with the majority qualifying as severely rent burdened. These rates are below City (72.3% of rented households qualify as rent burdened) and Asian households (75.3%).
JUMP TO: Population | Immigration, Citizenship, Mobility | Education & English | Income & Poverty | Benefits & Health | Employment | Housing | Technology
Technology
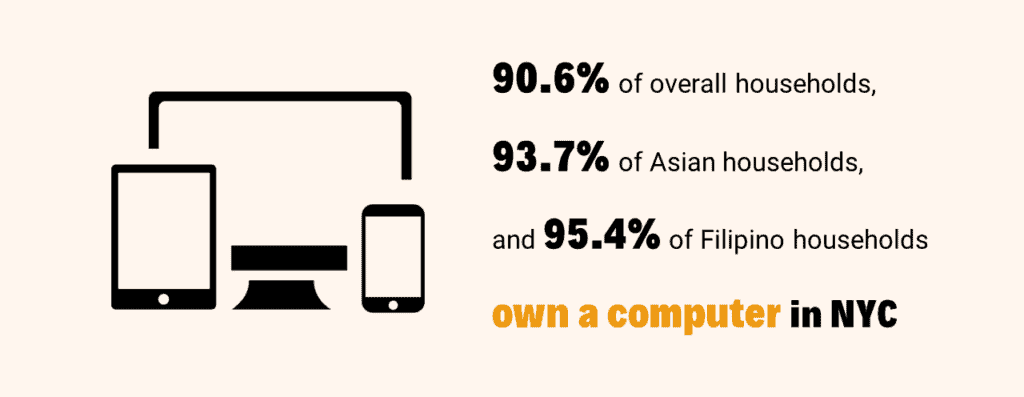
Filipino households3 report owning a computer at higher rates than Asian and City households.
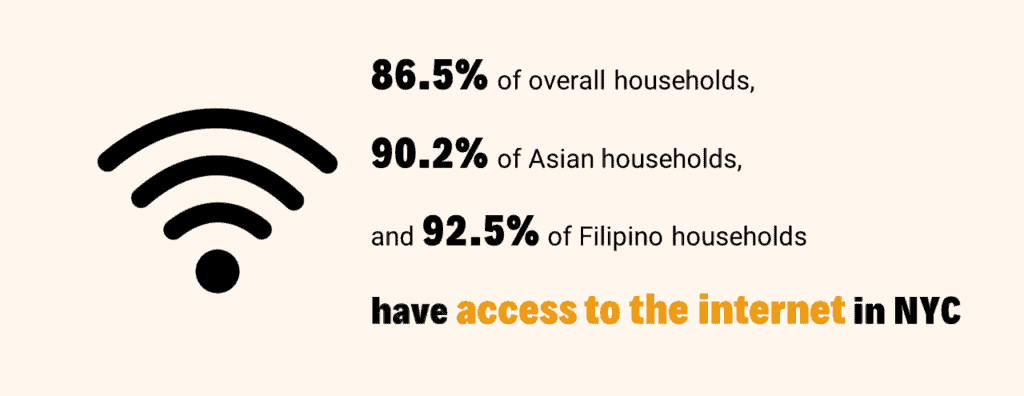
Filipino households3 also report higher internet access rates than Asian and City households.
JUMP TO: Population | Immigration, Citizenship, Mobility | Education & English | Income & Poverty | Benefits & Health | Employment | Housing | Technology