Japanese in NYC: A Profile
Population
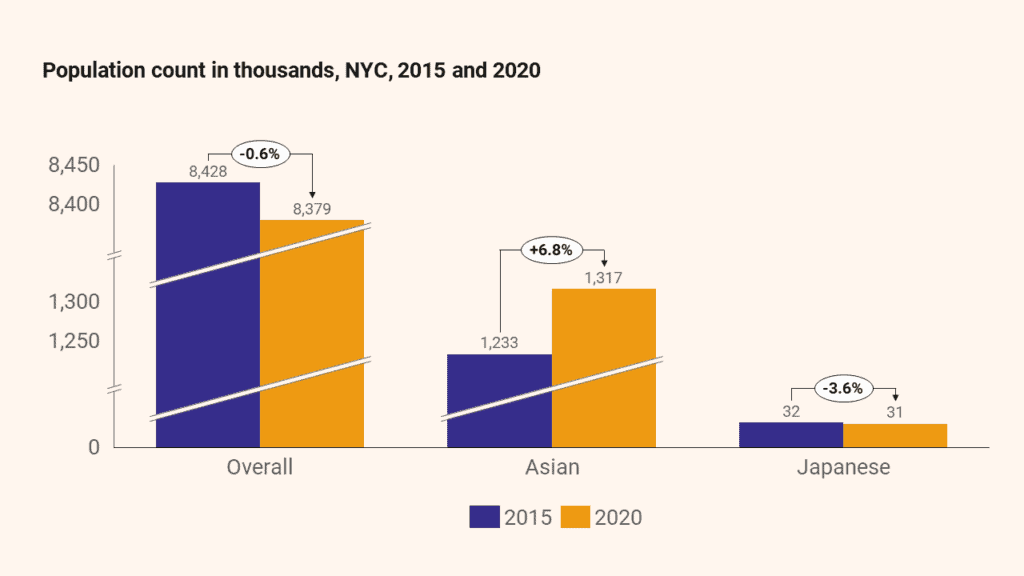
Between 2015 and 2020, the Japanese1 population in NYC shrunk (-3.6%) faster than the City population (-0.6%). In contrast, the Asian2 population grew by 6.8%.
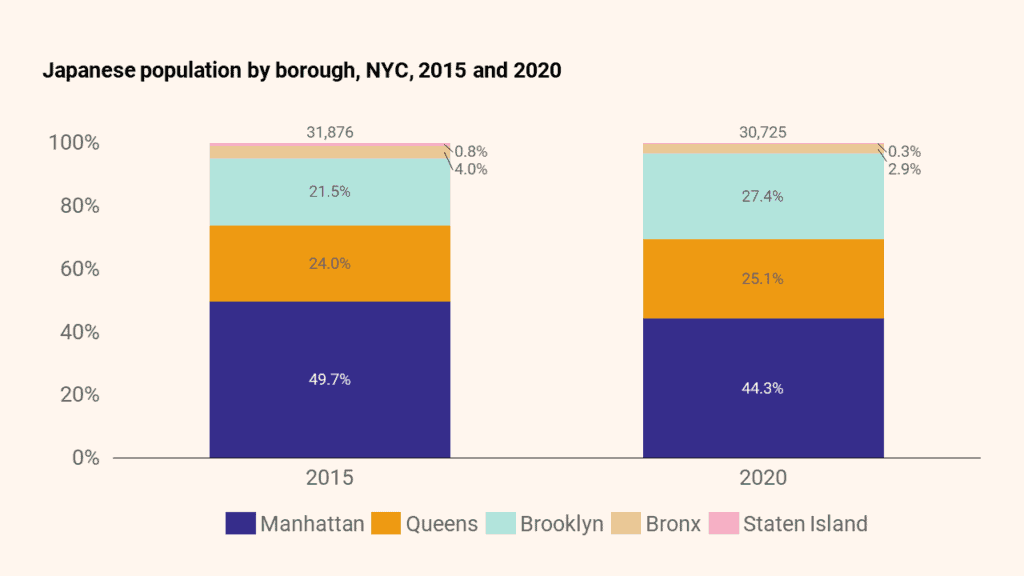
During this time, the Japanese population moved away from Manhattan (-5.4 percentage points) and shifted into Brooklyn (+5.9 percentage points). Even with this shift, no other Asian ethnic group has as high a proportion of its population living in Manhattan (44.3%) or as low a proportion living in Queens (25.1%) or Staten Island (0.3%).
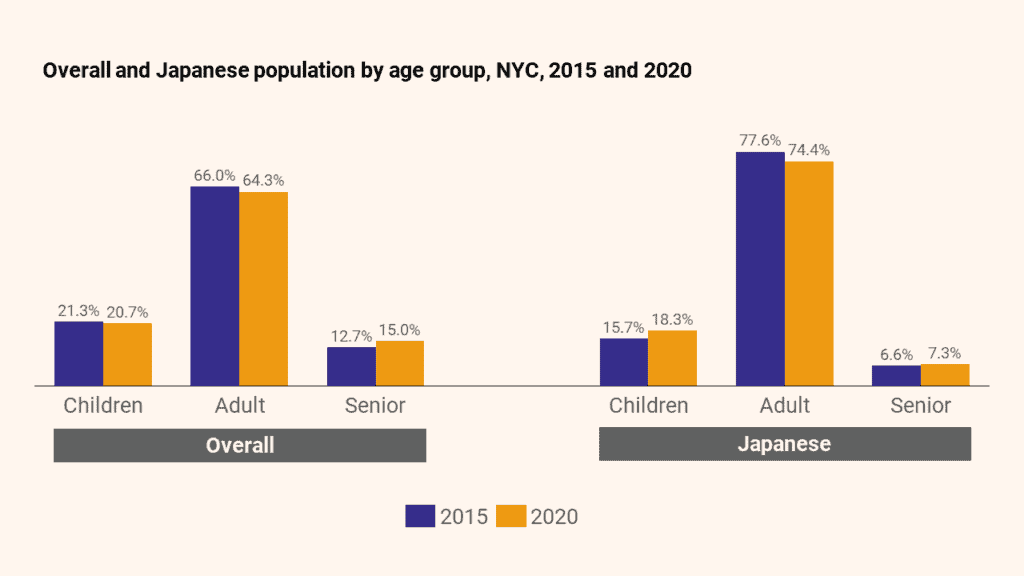
Compared to other Asian ethnic groups, the Japanese population in NYC has the highest proportion of adults (74.4%) and the lowest proportion of seniors (7.3%). However, the share of children under 18 in the overall Japanese population is growing: they now are 2.6 percentage points more of the total Japanese population than in 2015.
JUMP TO: Population | Immigration, Citizenship, Mobility | Education & English | Income & Poverty | Benefits & Health | Employment | Housing | Technology
Immigration, Citizenship, & Mobility
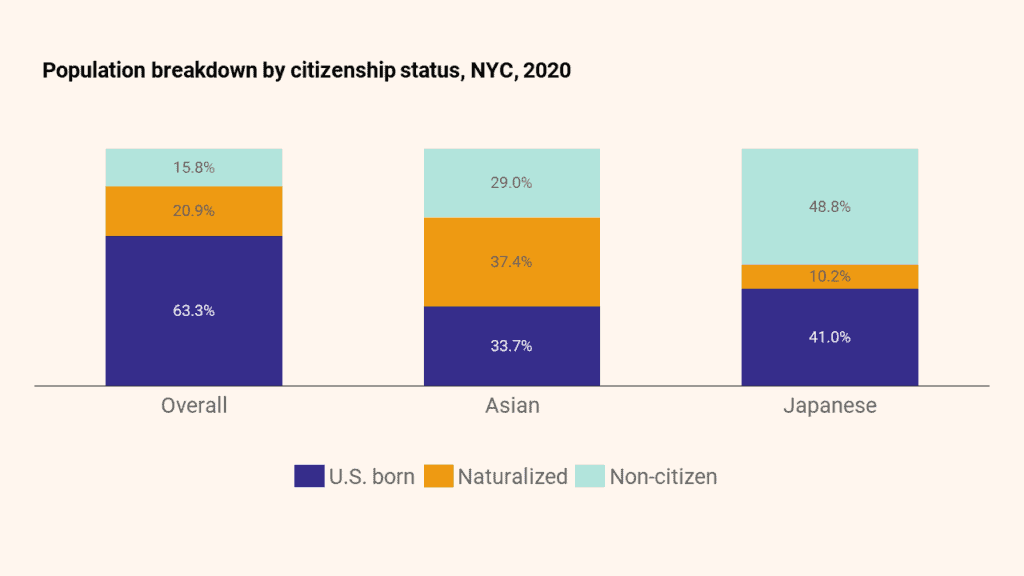
The Japanese population has the highest percentage of non-citizens (48.8%) and the lowest percentage of naturalized citizens (10.2%) compared to other Asian ethnic groups. The proportion of Japanese with U.S. citizenship by birthright has gone up (+5.2 percentage points) while the proportion of non-citizens has gone down (-4.8 percentage points) since 2015. In contrast, most people in NYC became citizens by birthright (63.3%) and naturalization (20.9%). Some 15.8% of New Yorkers are non-citizens.
Only one-third (36.7%) of New Yorkers, in general, are foreign-born, while about two-thirds (59.0%) of Japanese residents are.
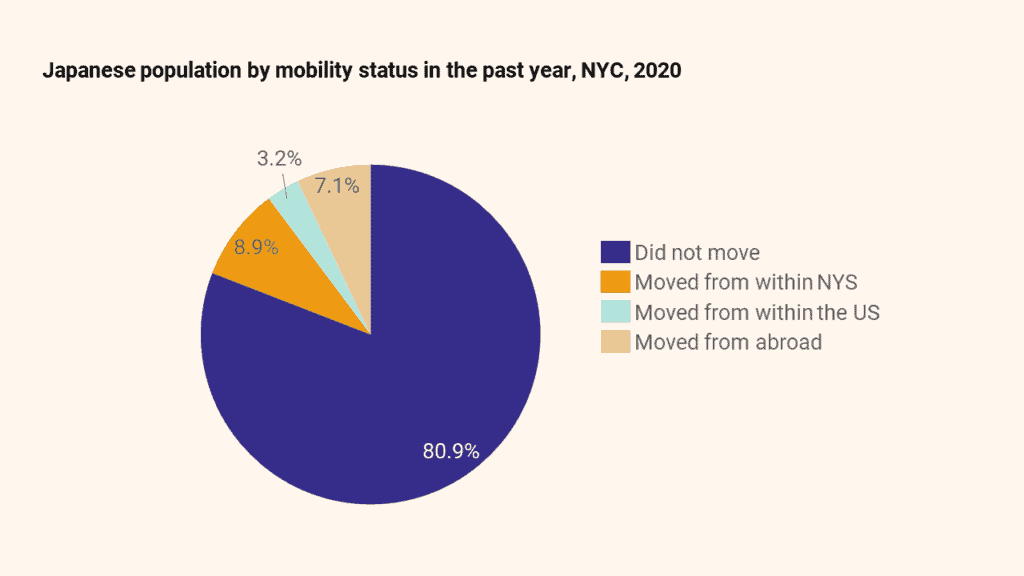
The Japanese are the most mobile Asian ethnic group in NYC. 25.3% of foreign-born Japanese arrived in the City within 5 years of the survey. Within one year of the survey, 7.1% of the overall Japanese population had relocated to NYC from abroad.
JUMP TO: Population | Immigration, Citizenship, Mobility | Education & English | Income & Poverty | Benefits & Health | Employment | Housing | Technology
Education & English
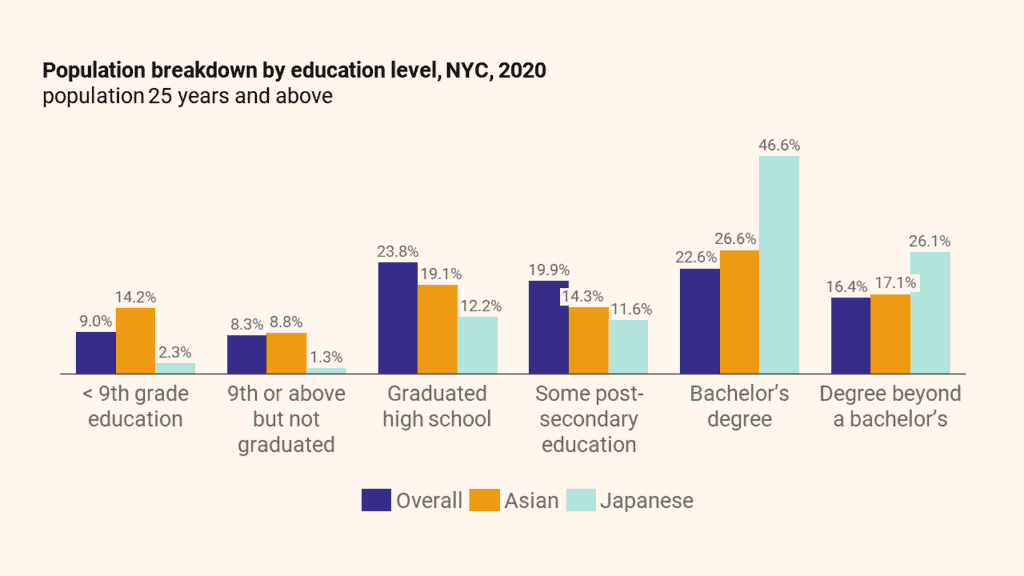
The Japanese are among the most educated Asian ethnic groups. Education levels for Japanese aged 25 and older in NYC skew towards higher education, with only 3.6% holding less than a high school education and over half (52.7%) holding a bachelor’s degree or higher. This is more educated than the City overall, where 17.3% have less than a high school education and only 39.0% hold a bachelor’s degree or higher. Japanese adults have the highest proportion of people who hold a degree beyond a bachelor’s (26.1%) compared to any other Asian ethnic group.
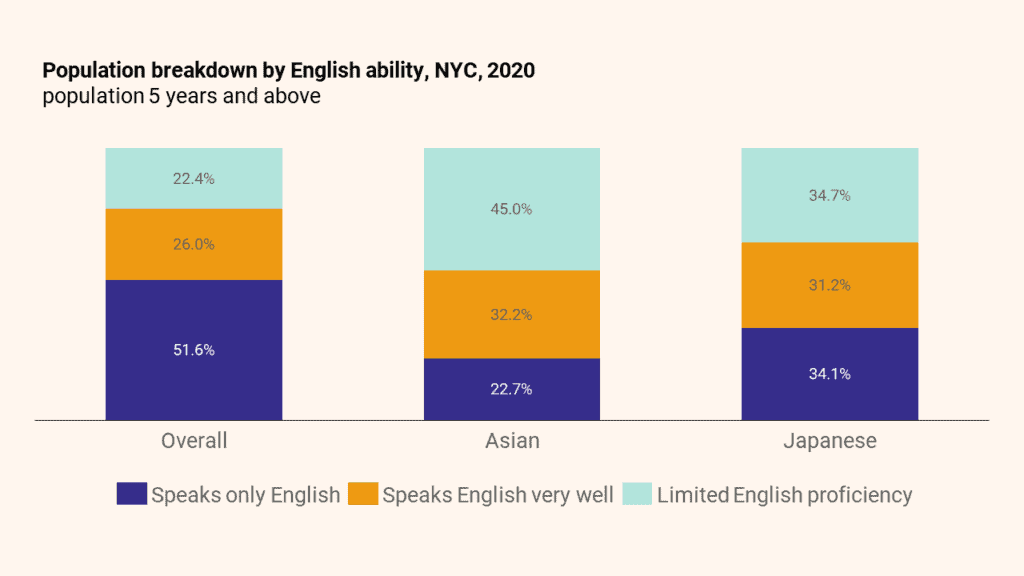
The Japanese community’s English proficiency levels are lower than those of NYC overall, with 34.7% of Japanese over the age of 5 considered to have limited English proficiency (LEP) versus the City’s 22.4% rate. The LEP rate is lower for Japanese children (5+ but under 18) at 12.1% but significantly higher for Japanese seniors (age 65+) at 53.9%.
JUMP TO: Population | Immigration, Citizenship, Mobility | Education & English | Income & Poverty | Benefits & Health | Employment | Housing | Technology
Income & Poverty
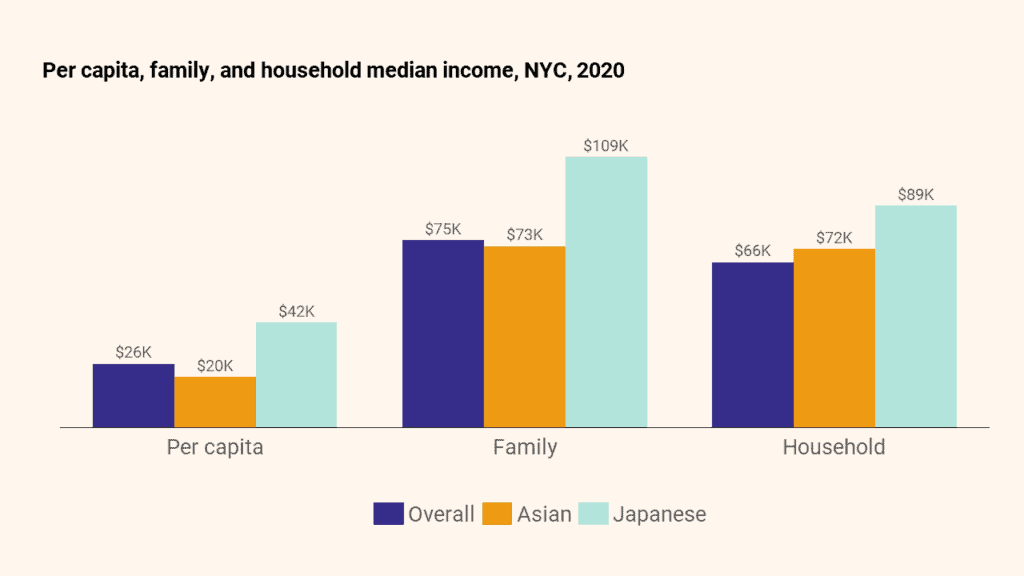
Japanese New Yorkers have above-average per capita, family, and household median incomes compared to New York City residents overall. They also have the highest per capita median income compared to other Asian ethnic groups.
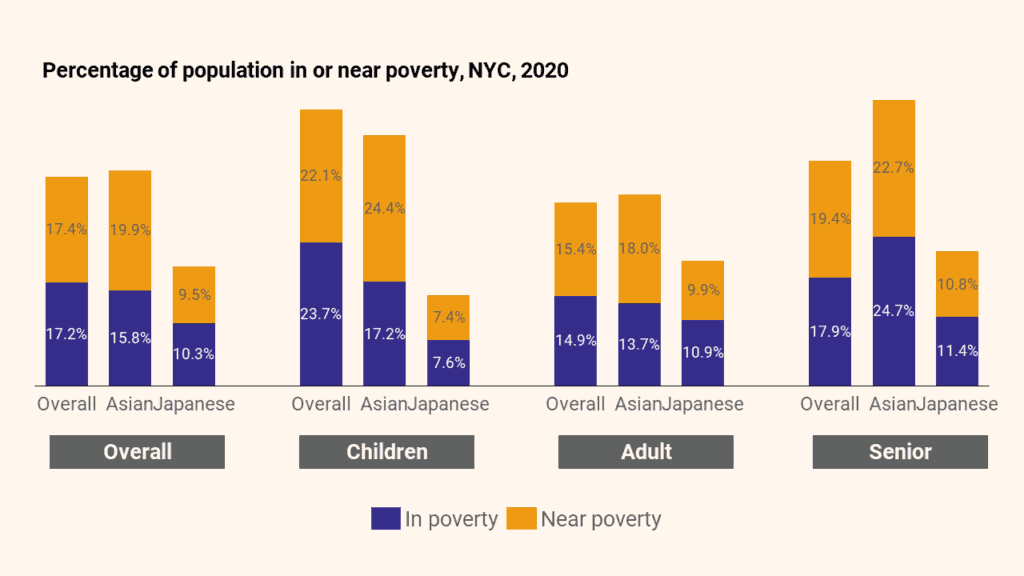
Japanese poverty rates are below-average compared to both NYC and Asian populations.
JUMP TO: Population | Immigration, Citizenship, Mobility | Education & English | Income & Poverty | Benefits & Health | Employment | Housing | Technology
Benefits & Health
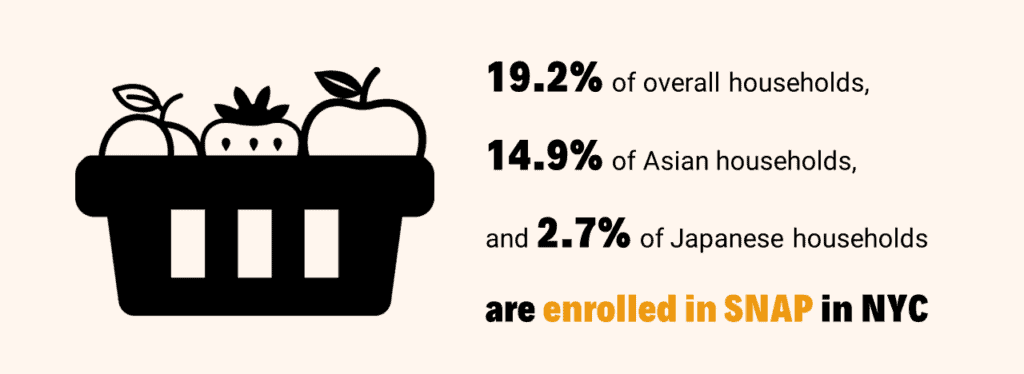
Japanese households3 are enrolled in SNAP at a significantly lower rate than New York City households and have the lowest rate of SNAP enrollment (2.7%) compared to other Asian ethnic groups.
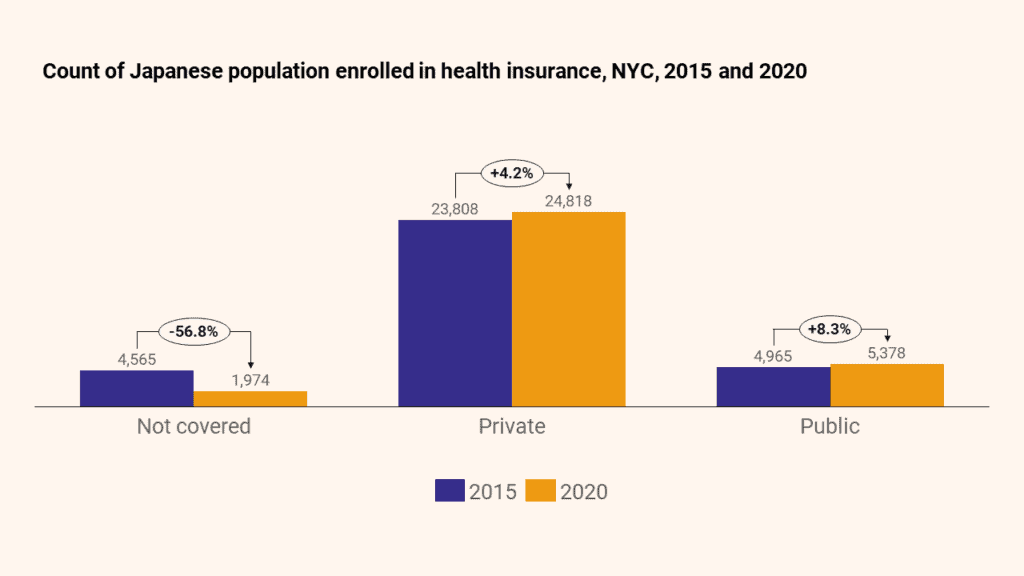
The Affordable Care Act has significantly reduced the number of uninsured in NYC, and the Japanese population is no exception. Between 2015 and 2020, 56.8% fewer Japanese people were uninsured. The Japanese have the highest proportion of people enrolled in private insurance (80.8%) and the lowest proportion in public insurance (17.5%) compared to other Asian ethnic groups.
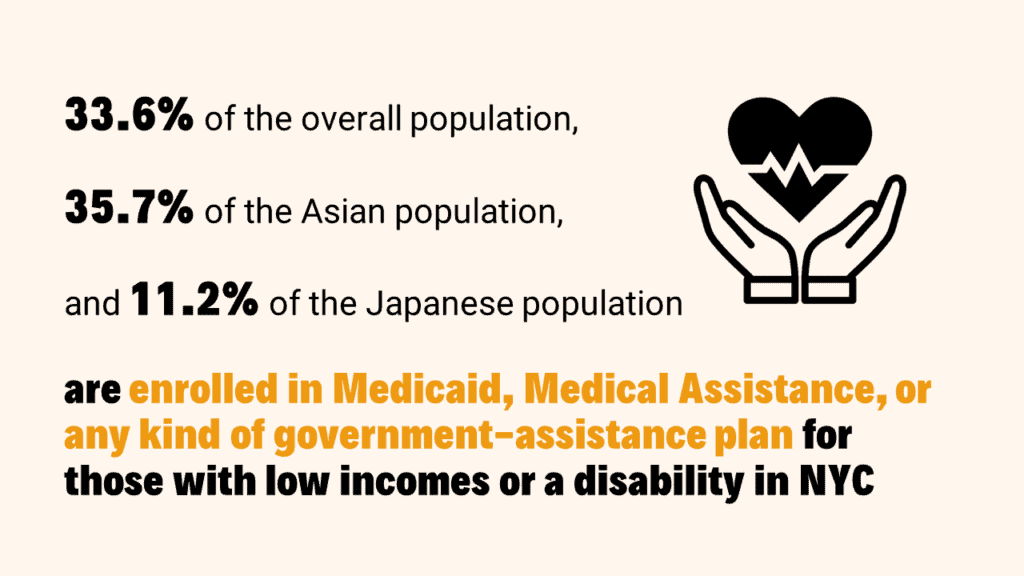
A much lower percentage of the Japanese population is enrolled in government-assisted health insurance compared to both the general NYC and Asian populations. The population’s 11.2% enrollment rate is the lowest among Asian ethnic groups.
JUMP TO: Population | Immigration, Citizenship, Mobility | Education & English | Income & Poverty | Benefits & Health | Employment | Housing | Technology
Employment
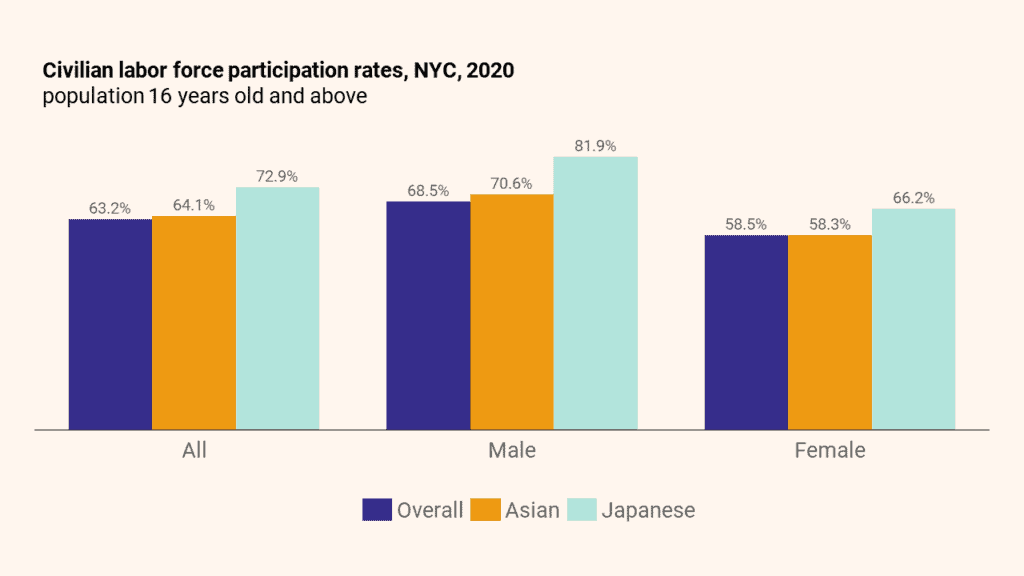
Japanese labor force participation rates are above-average for both male and female workers. Among other Asian ethnic groups, the Japanese have the highest labor force participation rate overall and for male workers.
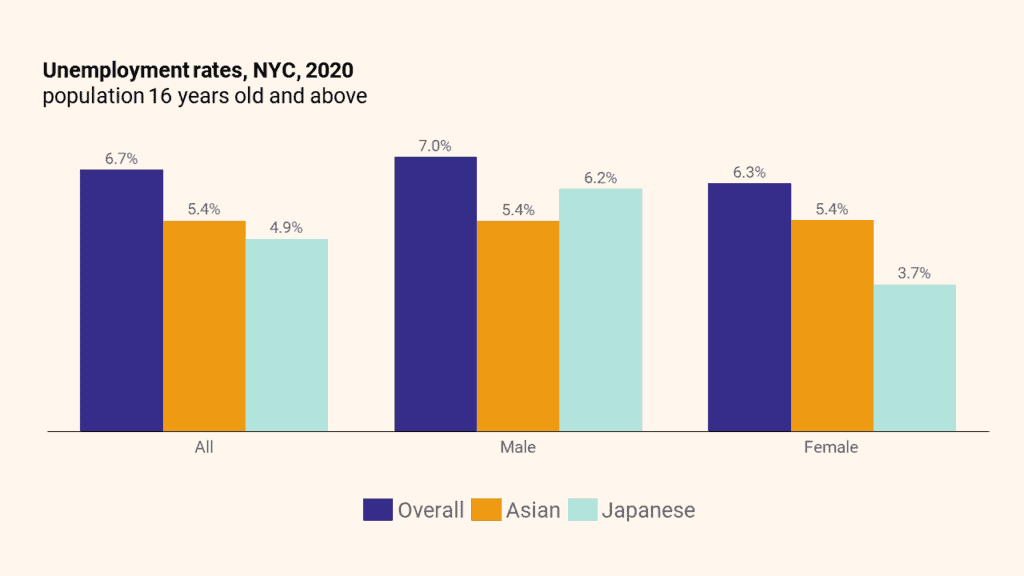
Japanese unemployment rates are lower than City rates across the board. The female Japanese unemployment rate (3.7%) is almost half of the male Japanese unemployment rate (6.2%).
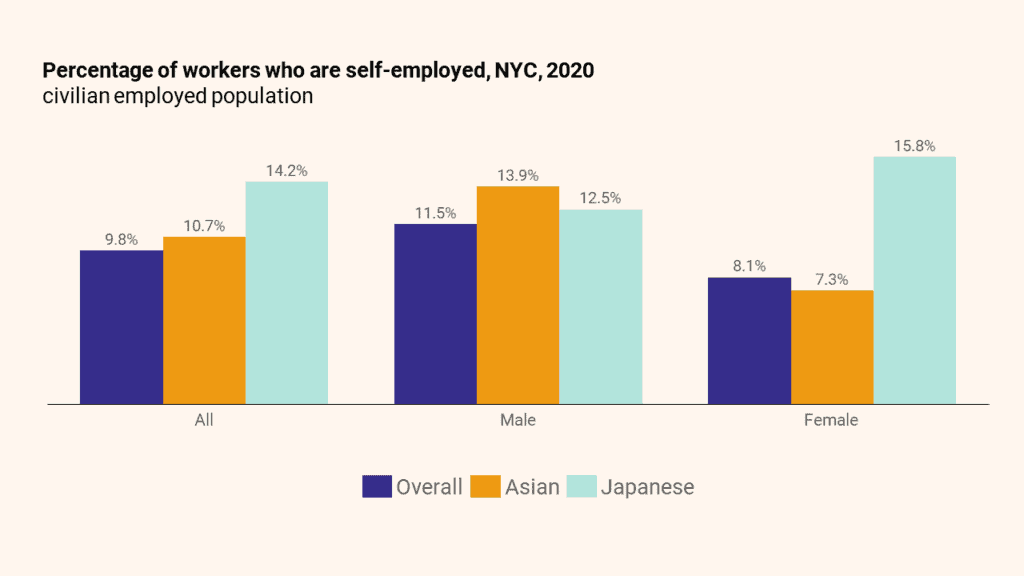
Japanese employees have the highest rates of self-employment compared to other Asian ethnic groups. This is driven by female Japanese employees, whose self-employment rates (15.8%) are nearly double that of the City rate (8.1%) and also higher than the male Japanese self-employment rate (12.5%).
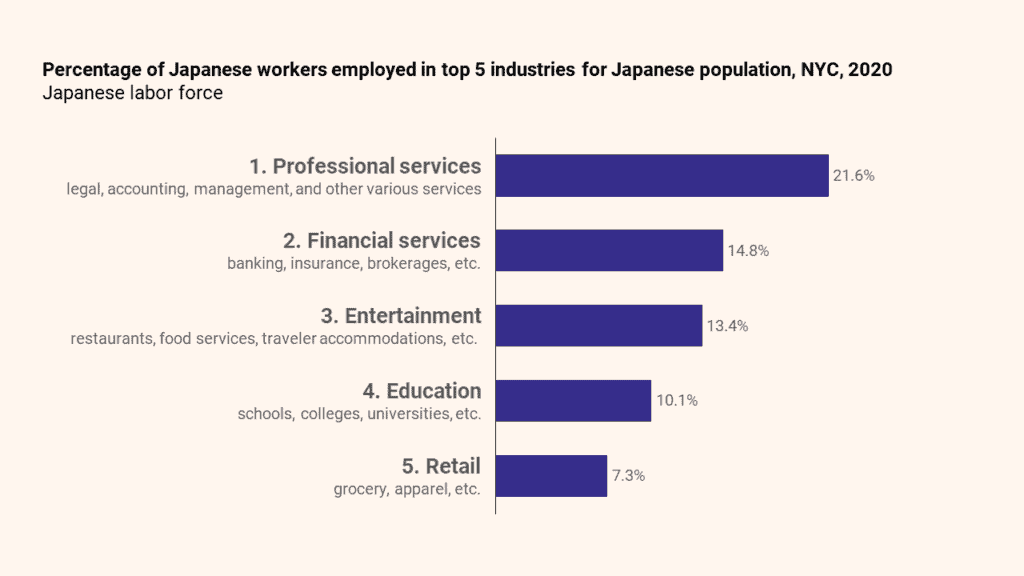
Two-thirds (67.2%) of the Japanese labor force is employed by five industries. The highest percentage of Japanese employed by a single industry is 21.6% in professional services. Within professional services, 18.1% of Japanese work in computer systems design, 16.5% work in specialized design services, and 9.9% work in management, scientific, and technical consulting services.
JUMP TO: Population | Immigration, Citizenship, Mobility | Education & English | Income & Poverty | Benefits & Health | Employment | Housing | Technology
Housing
Average household size, NYC, 2015 and 2020
| Household group | 2015 | 2020 |
| Overall | 2.65 | 2.57 |
| Asian | 3.10 | 2.98 |
| Japanese | 2.24 | 2.27 |
Japanese household3 sizes in 2020 have remained about the same since 2015 (2.24 vs. 2.27). Japanese households are slightly smaller than City households (2.27 vs. 2.57) and are the smallest when compared to other Asian ethnic groups. In general, average household sizes have decreased in New York City since 2015 – Japanese households prove to be an exception.
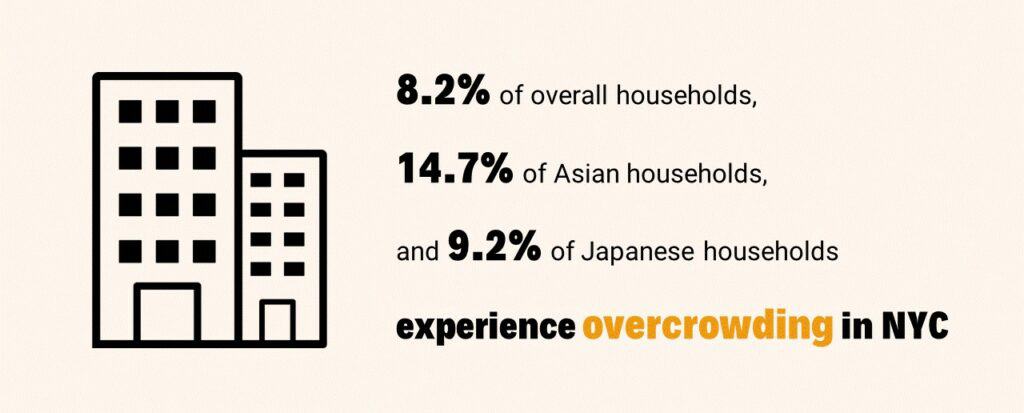
Japanese households3 are overcrowded (9.2%) at about the same rate as City households (8.2%) but at a lower rate than Asian households (14.7%).
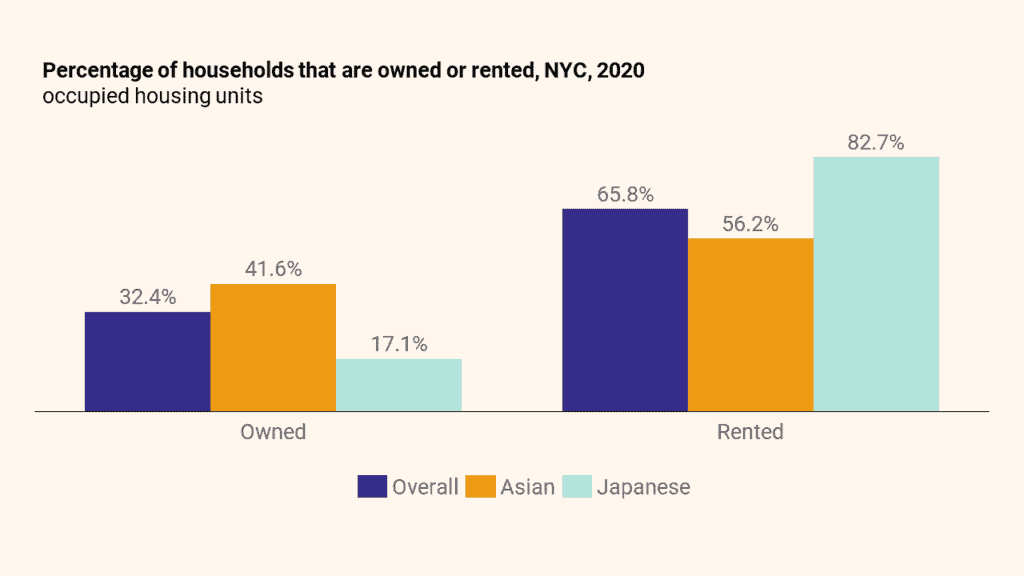
Japanese households3 own their homes at a lower rate and rent at a higher rate than City and Asian households. While 32.4% of the City households are owned, only 17.1% of Japanese households are owned. Japanese New Yorkers have the lowest homeownership rates (and highest renting rates) compared to other Asian ethnic groups.
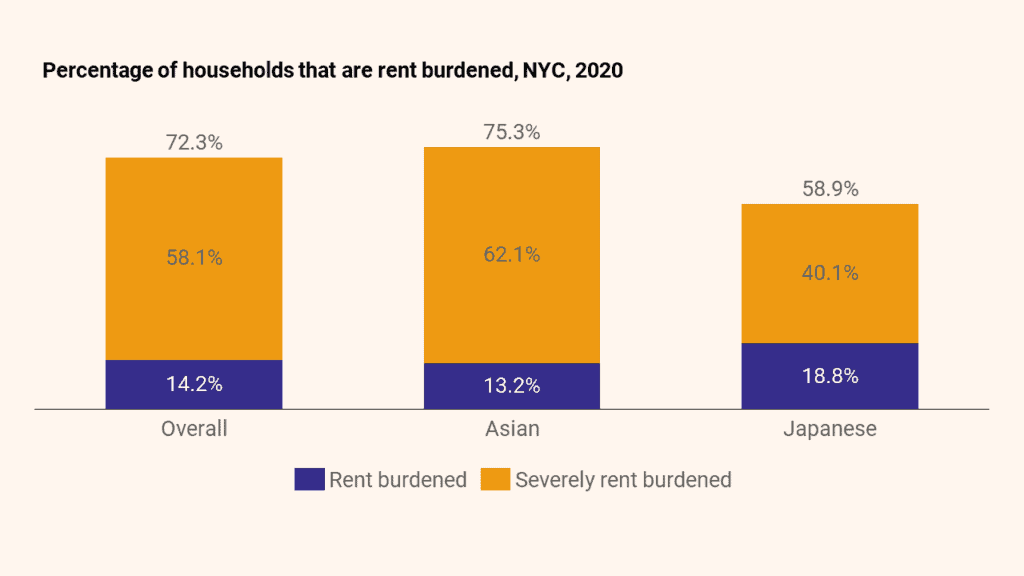
While a significant proportion of Japanese households3 rent, Japanese renters are less rent burdened compared to City and Asian renters. 58.9% of rented Japanese households are rent burdened in some capacity, with the majority qualifying as severely rent burdened. These rates are below City (72.3% of rented households qualify as rent burdened) and Asian households (75.3%).
JUMP TO: Population | Immigration, Citizenship, Mobility | Education & English | Income & Poverty | Benefits & Health | Employment | Housing | Technology
Technology
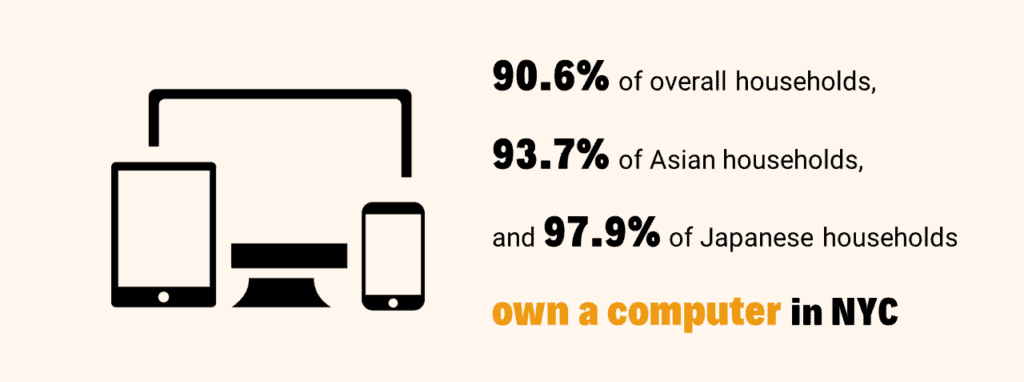
Among Asian ethnic groups, Japanese households3 report the highest rates of computer ownership.
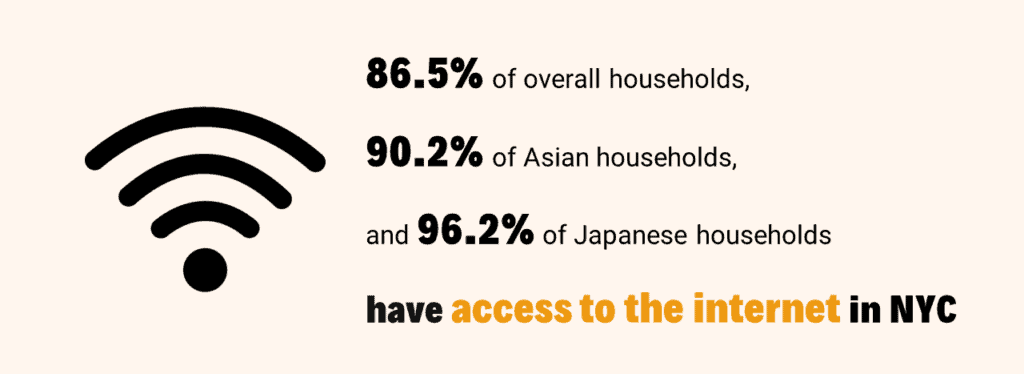
Japanese households3 also report the highest internet access rates compared to other Asian ethnic groups.
JUMP TO: Population | Immigration, Citizenship, Mobility | Education & English | Income & Poverty | Benefits & Health | Employment | Housing | Technology