The Washington metropolitan area encompasses the District of Columbia and nearby parts of Maryland and Virginia. Currently, the area is home to 85,140 Koreans. Within this demographic, 4.29% live in the District of Columbia, 70.29% reside in Virginia, and 25.42% in Maryland. In Maryland, Montgomery County is home to 76.68% of the state’s Korean population. Similarly, in Virginia, Fairfax County hosts 70.09% of the Koreans living in the state.
Demographic Data
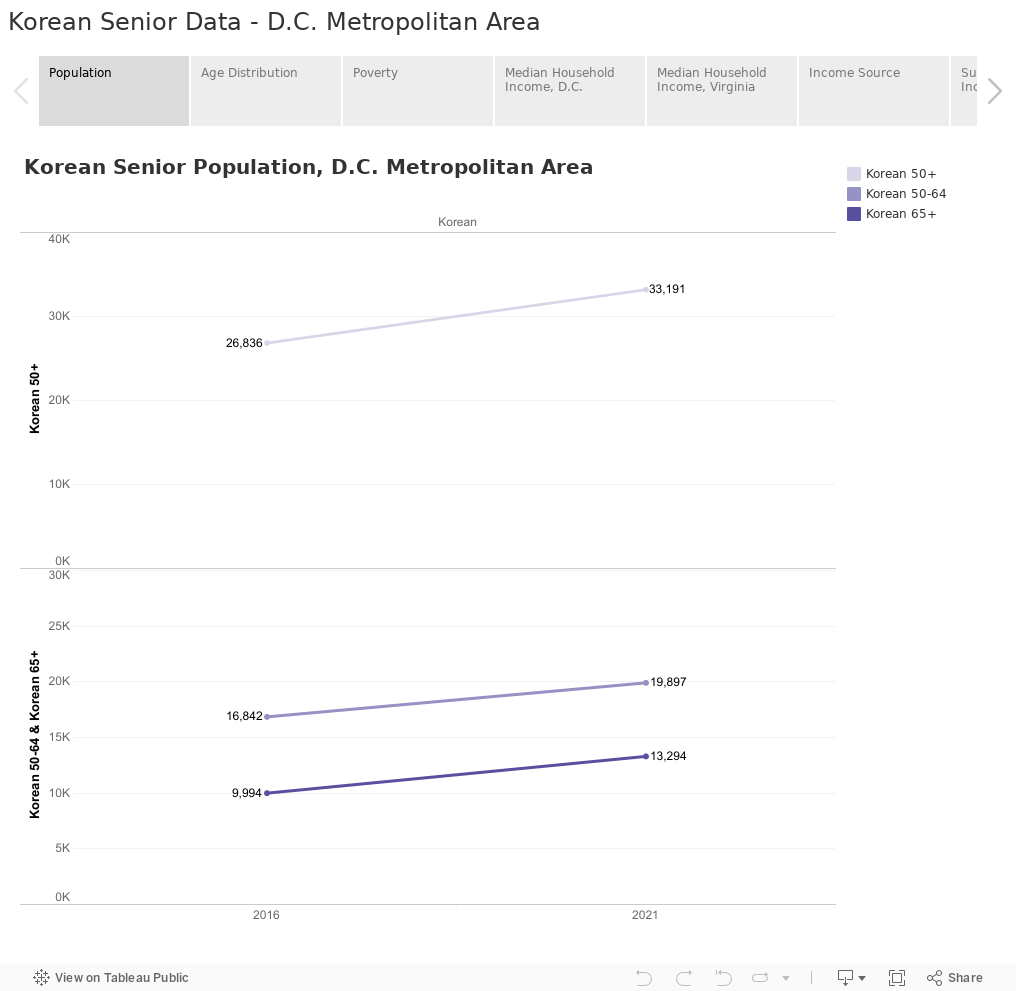
From 2016 to 2021, the population growth rate of Korean seniors in the 65+ age group (33.0%) was nearly twice that of the 50-64 age group (18.0%) in D.C.
Korean seniors aged 65 and older in the D.C. metropolitan area consistently have higher poverty rates compared to both the broader Asian population and the general population. Also, Korean seniors aged 65+ experience much higher poverty rates than those aged 50 to 64.
Households headed by Korean seniors aged 65 and above generally depend more on Social Security benefits and less on retirement funds for their household income compared to households led by Asian seniors and seniors in general. Additionally, a smaller percentage of Korean senior households (20.0%) receive retirement income compared to both the general senior households (49.0%) and Asian senior households (27.1%).
Korean seniors aged 65 and older consistently have higher rates of limited English proficiency compared to their counterparts of the same age group in both the broader Asian population and the general population in the D.C. metropolitan area
Korean senior households in the D.C. metropolitan area have more rental properties than general senior and Asian senior households. Typically, they experience lower rent burden rates compared to Asian seniors in general, but households led by Korean seniors aged 65 and older tend to face a higher rate of severe rent burden than their Asian senior peers.
Korean seniors aged 65 and older have lower levels of internet connectivity and smartphone usage compared to both Asian seniors and the general population in their age group.
Survey Findings
Among the 118 participants from the D.C. metropolitan area, 29% were between 50-64 years old, 35% were 65-74, 25% were 75-84, and 11% were 85 or older. 63% of participants were female and 37% were male. A majority of participants (69%) relied on Medicare or Medicaid for healthcare coverage, 21% had private insurance, 2% were uninsured, and 6% had both public and private insurance. Among those 65 and older, 22% were still in the labor force: 10% part-time, 4% full-time, and 8% unemployed.
A majority of participants, 57%, had considered moving into an assisted living apartment or community, compared to 31% who had not.
More than half of the participants (58%) expressed a desire to stay in their homes when in need of long-term care. One in four indicated that an assisted living facility would be their preferred option.
The majority of participants (80%) drove as their primary mode of transportation. Ridesharing was the second most popular option, with 13% of participants identifying it as their main way to get around. Among those who primarily drove, about half (51%) expected to continue driving into their 80s.
The main reason 43% of participants avoided or were unhappy with public transportation was the long distance to stations. Safety concerns were the second major issue, affecting 15% of participants.
32% of participants said it was at least sometimes physically demanding to get to places outside of their homes.
77% of participants turned to family members for help when needed. Friends were the second choice with 16% of participants turning to them for help.
Language was the biggest barrier to accessing professional caregiving for 44% of participants, followed by a lack of information for 37% of participants.
33% of participants rated their health as 5 or lower on a scale from 1 to 10, with 1 being the worst possible rating. The most frequent chronic conditions reported were hypertension and high cholesterol, each affecting 50% of participants, followed by diabetes and eye conditions, both at 27%.
90% of participants did know where to call or who to go to in case they became ill, and 96% of participants did have a primary care physician.
Language was the most common barrier to accessing care with 47% of participants mentioning it as a difficulty. Other common obstacles were a lack of information (25%) and technology difficulties (19%).
The majority (60%) believed their income was either somewhat or entirely insufficient to cover basic needs. Among those who felt their income was insufficient, 31% struggled with food, 27% with rent, 22% with healthcare, and 16% with transportation.
36% of participants felt isolated or anxious at least some of the time. 34% of participants said those feelings had worsened since the start of the pandemic.
15% of participants did not feel they had access to professional mental health services that address their needs.
23% of those who were not interested in more social activities mentioned language barriers as their reason.
Friends or relatives were the primary source of information about services and programs for 56% of participants. Newspapers ranked second, with 39% of participants relying on them, followed by community magazines or flyers (36%) and social media (25%).
Participants’ top preference was for more hobby and interest clubs (28%). Other services or programs they were interested in were legal assistance (14%), mental health support (14%), and accessible transportation (12%).
Technical Notes
This analysis utilizes data from the 2016 and 2021 American Community Survey 5-year Public Use Microdata Samples, focusing on the “alone” Census category for the Korean population. This means that the term “Korean alone” refers to individuals who identified exclusively as Korean without reporting affiliation with any other ethnic category. Respondents who identified as Korean in addition to another racial group (for instance, Korean and Black) are not included in the “Korean alone” count. In any analysis leveraging Census Bureau data, the “alone” figure should be regarded as the minimum size of the population under consideration.
This report was co-authored by Linying He, Associate Director of Research, and Research Associates, Dena Li and Yuncheng Wang. Special thanks to Meera Venugopal, Director of Communications, Jenny Shin, Senior Communications Coordinator, and Annie Yang, Social Media Coordinator, for their design and editorial input. Illustrations were designed by Michelle Kwon, freelance illustrator and animator. Rushil Shakya, freelance web consultant, contributed to web development.