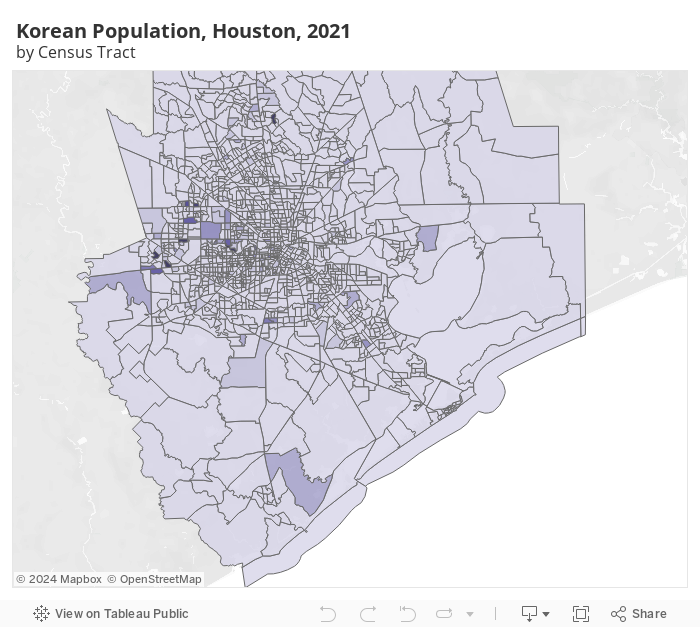
6,635 Koreans live in the Houston metropolitan area, mainly in Harris and Fort Bend Counties. Among various neighborhoods, Spring Branch has the highest concentration of Koreans in the Houston area.
Demographic Data
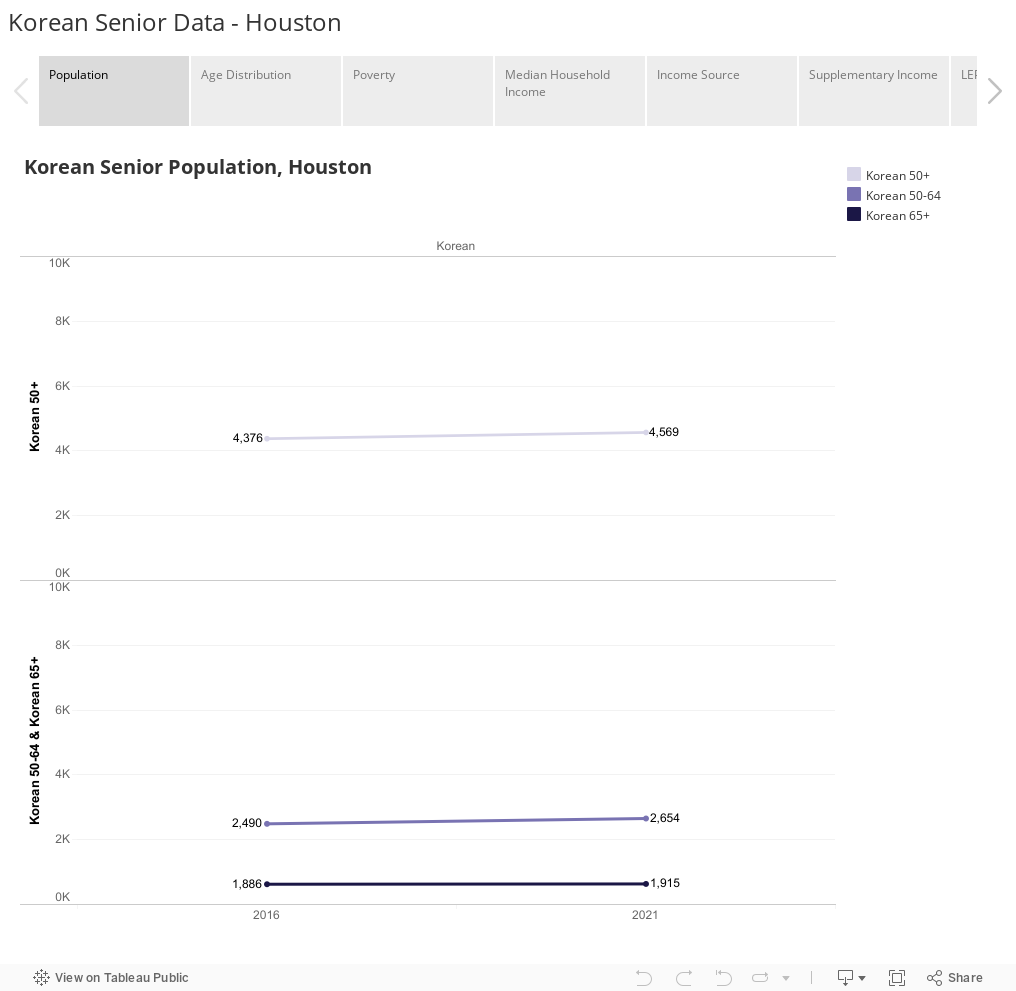
Between 2016 and 2021, Houston’s Korean senior population grew by 4.4%, significantly less than those of other major U.S. cities.
The poverty and near-poverty rates among Korean seniors aged 65 and over in Houston have consistently been higher than those in the broader Asian population and the general population of the area.
Korean seniors aged 65 and above face significantly higher poverty and near-poverty rates compared to Korean seniors aged 50 to 64. In 2021, their median household income was considerably lower than that of Koreans aged 50 to 64, a change from the situation in 2016 when their incomes were more comparable.
The median household income of Korean seniors in Houston remains consistently lower than that of both the general senior population and the Asian senior population.
Korean senior households in Houston rely less on retirement funds for their household income compared to households led by seniors in general.
The percentage of Korean seniors receiving retirement income (16.4%) is less than that of both the general senior population (33.8%) and Asian seniors (18.7%) in Houston.
The percentage of the population with limited English proficiency among Korean seniors has been consistently higher than those of the general senior and Asian senior populations.
Korean households led by older adults aged 65 and above have a higher percentage of rentals compared to both general households and Asian households led by the same age group.
Survey Findings
Among the 100 survey participants from Houston, 47% were aged between 50 and 64, 25% were 65-74, 20% were 75-84, and 8% were 85 years or older. Gender distribution was evenly split, with half of the participants being female and the other half male. Among the participants aged 65 and older, approximately 34% were still working, with 21% employed part-time and 13% working full-time. 50% of participants relied on Medicare or Medicaid for healthcare coverage, 37% had private insurance, and 13% were uninsured.
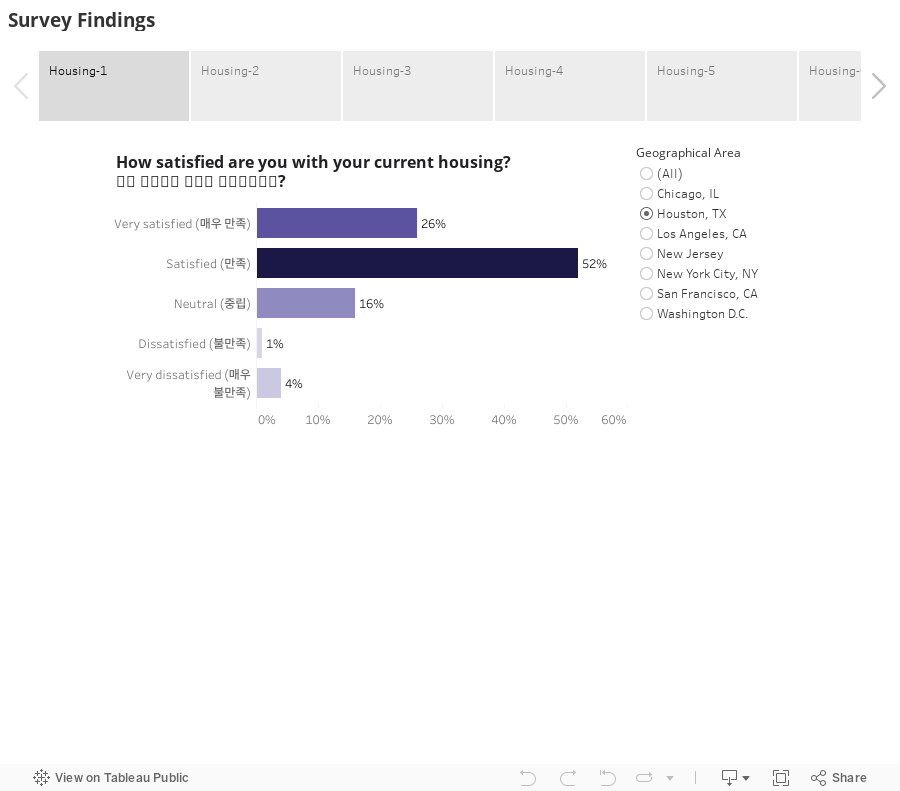
75% of the participants were homeowners. Out of these homeowners, 41% still had mortgages to pay.
51% of the participants had considered the possibility of living in assisted living facilities. Among those contemplating this choice, 41% were primarily concerned about the cost while 28% highlighted the importance of language accessibility in their decision-making process.
Nearly half of the participants (49%) expressed a desire to stay in their homes when in need of long-term care while just under a third (31%) indicated that moving to an assisted living facility would be their preferred option.
95% of participants relied on driving as their primary mode of transportation. Looking ahead, 50% of survey participants expected to continue driving into their 80s, and 27% wanted to keep driving into their 90s.
27% of participants said safety was a reason they did not use public transportation or were not satisfied with it.
86% of participants sought help from family members when needed. For 45%, language barriers prevented them from accessing professional caregiving. Additionally, 42% struggled to get the information they needed when seeking assistance.
The participants experienced prevalent chronic conditions with hypertension being the most common at 37%, followed closely by cholesterol issues, at 36% and diabetes at 21%. Nearly all participants (96%) had a designated place to go to or person to call in case they fell ill.
The most common obstacle participants faced in accessing healthcare was language barriers, an issue that affected 43% of them. Other common barriers were a lack of information (33%), difficulty using technology (22%), and financial hardship (22%).
21% of participants expressed that their income fell short of covering their basic needs with an additional 26% considering it only somewhat sufficient. For participants who had insufficient income, 32% identified food, 28% mentioned healthcare, and 26% cited rent as unmet needs.
Among the participants, 26% experienced feelings of isolation or anxiety at least some of the time. Furthermore, 24% of the participants reported that these feelings had worsened since the beginning of the pandemic.
90% of participants did not feel they had access to professional mental health services that address their needs.
55% of participants wanted more active social lives.
A majority of participants (56%) read newspapers as their primary source of information about programs and services. Following closely behind, friends and relatives were the second most common source, providing information to 55% of participants. Social media played a role for 36% of the participants while community magazines and flyers were consulted by 34%.
The participants expressed a strong desire for more hobby and interest clubs, with 36% of them showing interest in such programs. Other services that participants were interested in were legal assistance programs (30%), mental health support services (21%), and improved access to public transportation (21%).
Technical Notes
This analysis utilizes data from the 2016 and 2021 American Community Survey 5-year Public Use Microdata Samples, focusing on the “alone” Census category for the Korean population. This means that the term “Korean alone” refers to individuals who identified exclusively as Korean without reporting affiliation with any other ethnic category. Respondents who identified as Korean in addition to another racial group (for instance, Korean and Black) are not included in the “Korean alone” count. In any analysis leveraging Census Bureau data, the “alone” figure should be regarded as the minimum size of the population under consideration.
This report was co-authored by Linying He, Associate Director of Research, and Research Associates, Dena Li and Yuncheng Wang. Special thanks to Meera Venugopal, Director of Communications, Jenny Shin, Senior Communications Coordinator, and Annie Yang, Social Media Coordinator, for their design and editorial input. Illustrations were designed by Michelle Kwon, freelance illustrator and animator. Rushil Shakya, freelance web consultant, contributed to web development.