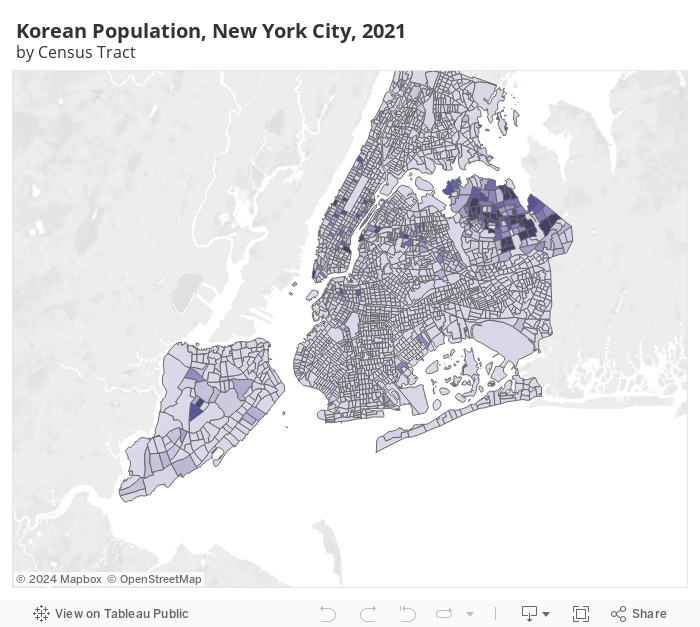
New York City is home to 80,846 Korean residents, the majority of whom (59%) live in Queens. The remaining Korean New Yorkers live in Manhattan and Brooklyn. Neighborhoods with higher concentrations of Korean are Bayside, Douglaston, Elmhurst, Flushing, Murray Hill, Fresh Meadow, and Bay Terrace in Queens; and Stuyvesant Town in Manhattan.
Demographic Data
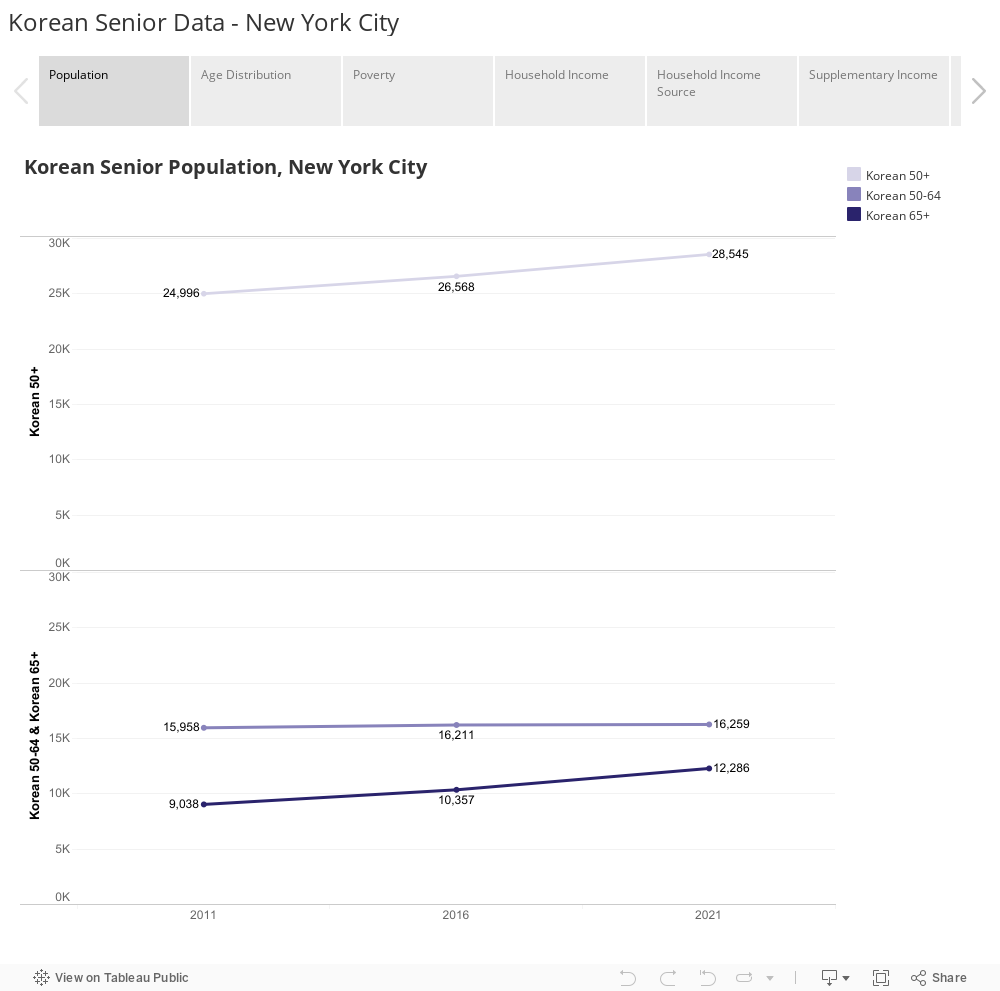
From 2011 to 2021, the population growth rate of Korean seniors (50+) in NYC was primarily driven by those in the 65+ age group, which experienced a growth rate of 35.9%, in contrast to the 3.1% growth rate of the 50-64-year-old group.
Korean seniors aged 65 and over in New York City have consistently experienced higher poverty and near-poverty rates compared to other Asian seniors and the overall senior population of the city.
Korean seniors over the age of 65 experience poverty and near-poverty at rates considerably higher than those of Korean seniors in the 50 to 64 age bracket.
The median household income of Korean seniors is consistently lower than those of the overall senior population and the Asian senior population in NYC.
Korean seniors aged 65 and over have a median household income that is notably less than that of Koreans aged between 50 and 64.
In New York City, households at all income levels headed by Korean seniors aged 65 and over depend more on Social Security benefits and less on retirement funds for their household income compared to households led by Asian seniors and by seniors overall in the city.
In high-income households (top 10 percentile), less than 3% of income comes from Social Security, whereas in low-income households (bottom 10 percentile), Social Security accounts for about half of the income.
The Korean senior population has a much higher limited English proficiency rate compared to the overall senior and Asian senior populations. In 2021, 4 out of 5 Korean seniors have limited English proficiency.
Korean senior households in NYC are more likely to rent than general senior households and Asian senior households. Korean seniors aged 65 and older who are renting their homes have the highest rate of severe rent burden compared to younger Korean seniors and senior groups of other races. Specifically, 46.7% of renters in this age group face a severe rent burden.
While Korean seniors generally have better internet and smartphone access than the broader senior and Asian senior populations, those over 65 lag behind their counterparts in the Asian and overall populations in terms of connectivity and smartphone use.
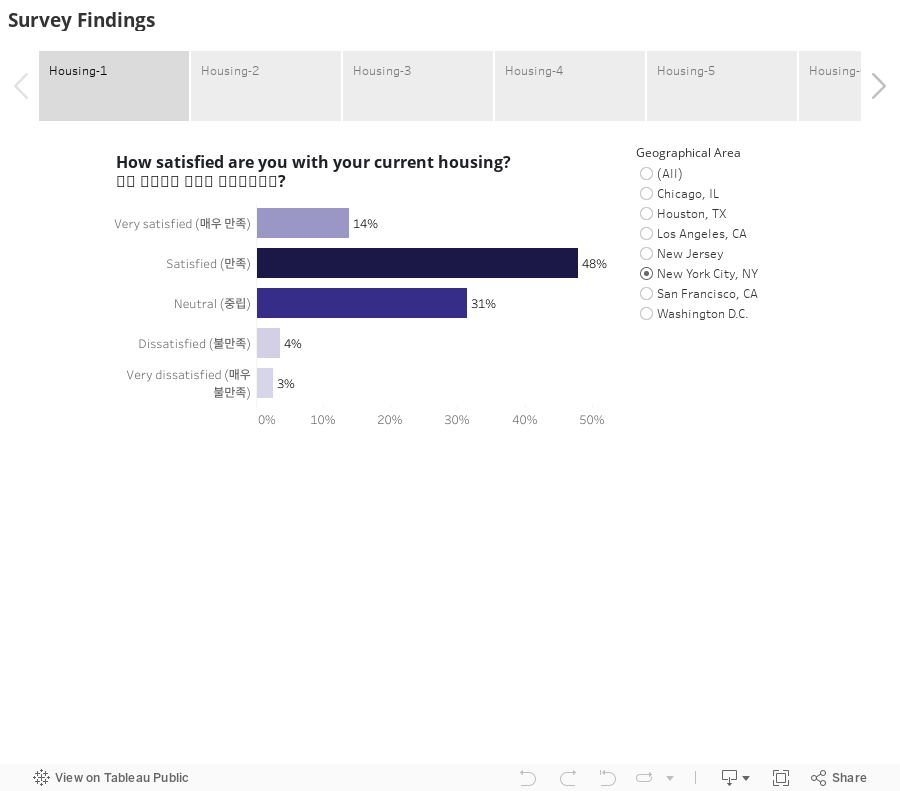
Survey Findings
Among 194 survey participants from New York City, 43% were aged 50-64, 32% were 65-74, 16% were 75-84, and 8% were 85 years and older. Gender-wise, around two-thirds (66%) were female, and one-third (34%) were male. Among those aged 65 and older, about a third were still employed, with 15% working full-time and 18% part-time. A majority (76%) relied on Medicare or Medicaid for medical care and 8% were not covered at all. 44% of participants did not have a college education, and 20% lacked internet access.
Among the participants, 70% were renters. 51% of those renters were rent-burdened, spending over 30% of their income on housing.
Even when faced with the need for long-term care, 55% of participants expressed a preference for remaining in their current homes. Meanwhile, only 27% viewed living with children or extended family as the ideal arrangement.
Among participants considering assisted living facilities, 36% of participants regarded cost as a significant factor in the decision-making process while 18% were concerned about the availability of Korean language assistance.
39% of participants used public transit as their primary means of transportation. However, 24% did not feel safe using it, and one in four cited safety concerns as a reason for not using or being unhappy with public transportation. Additionally, 34% either did not use public transit or were dissatisfied due to the distance to bus or train stations.
42% of participants said it was at least sometimes difficult to get to places outside of their home.
A large majority of participants—87% of participants under 65 years of age and 78% of those older than 65—looked to family members for help. While friends were the next most common group that those under 65 turned to for help, non-familial caregivers were the second most common group participants over 65 sought assistance from.
The most common barriers to accessing professional caregiving were language (46% of participants) and a lack of information (38% of participants).
Cultural stigma was a more prevalent barrier for female participants (21% of participants) compared to male participants (12% of participants).
26% of participants rated their health 5 or less on a scale of 1 to 10, with 1 being the worst. The most common chronic health conditions for participants were, in decreasing order of prevalence, cholesterol (45%), hypertension (43%), eye conditions or diseases (27%), diabetes (21%), and arthritis (19%).
A large majority of participants had somewhere to call if they were to get sick (95%) and a primary care physician (90%).
The primary barriers to healthcare access for the participants were a lack of information (37%) and language issues (36%). Financial hardship was a more significant issue for participants under 65 years old (19%) than those 65 and older (6%).
While 25% of participants 65 years and older did not feel their income was enough to cover basic needs, this rate was 45% for those under 65 years of age.
63% of participants who did not feel their income met their basic needs struggled with affording rent. 28% said their income was not enough for food.
Social security benefits and food stamps were the most common government-provided benefits participants reported using.
28% of participants experienced feelings of isolation or anxiety at least some of the time, and 34% reported that these feelings had worsened since the start of the pandemic.
The most popular spaces where people met with friends or relatives were private settings (55%) and religious communities (48%).
62% of participants expressed a desire for more social engagement with language barriers (12%) and a lack of culturally relevant events (10%) being the main obstacles to their participation in social activities.
Participants had the most familiarity with and access to public assistance (25%) and nutrition and wellness programs (23%).
For participants under 65 years old, friends or relatives and social media were equally common sources of information about services or programs (51% each), followed by community magazines/flyers (38%), and then newspapers (32%). Among those 65 and over, friends and relatives were the most common source of information (45%), followed closely by community magazines/flyers(44%) and with newspapers (27%) and social media (19%) also being key sources.
Participants were most interested in hobby/interest clubs (41%), legal assistance (27%), mental health support/services (22%), and access to public transportation (19%)
Technical Notes
This analysis utilizes data from the 2016 and 2021 American Community Survey 5-year Public Use Microdata Samples, focusing on the “alone” Census category for the Korean population. This means that the term “Korean alone” refers to individuals who identified exclusively as Korean without reporting affiliation with any other ethnic category. Respondents who identified as Korean in addition to another racial group (for instance, Korean and Black) are not included in the “Korean alone” count. In any analysis leveraging Census Bureau data, the “alone” figure should be regarded as the minimum size of the population under consideration.
This report was co-authored by Linying He, Associate Director of Research, and Research Associates, Dena Li and Yuncheng Wang. Special thanks to Meera Venugopal, Director of Communications, Jenny Shin, Senior Communications Coordinator, and Annie Yang, Social Media Coordinator, for their design and editorial input. Illustrations were designed by Michelle Kwon, freelance illustrator and animator. Rushil Shakya, freelance web consultant, contributed to web development.