INTRODUCTION
In 2020, New Jersey’s Asian population exceeded 1 million residents, representing a major milestone for Asian American representation and economic, social, and political influence in the state. Asians are currently New Jersey’s least populous major racial or ethnic group, but they are also its fastest growing group in the past decade. This report provides a fresh perspective on this rapidly emerging community by analyzing demographic data on population, age distribution, immigration and citizenship, educational attainment, English proficiency, employment, income, healthcare insurance coverage, and housing for the Asian population and 13 Asian ethnic communities in New Jersey. We aim to encourage discussions within and between communities, policymakers, and elected officials to further catalyze positive changes and support for the Asian American population in New Jersey.
MAP
Note: This map only shows the top population layer if multiple layers are selected at the same time. We suggest leave the boundary layer on and click on only one population layer at a time. Different layers may have different color legends, please click on the arrow next to each layer to show detailed legend.
POPULATION
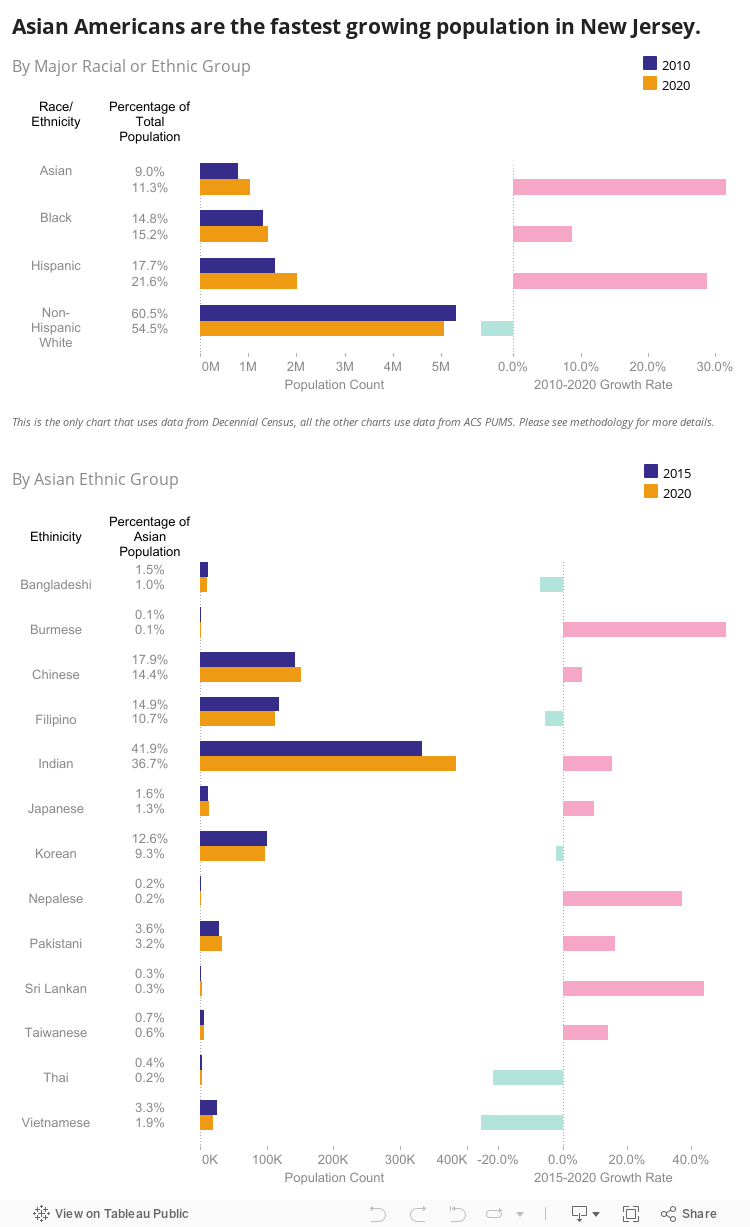
New Jersey’s Asian population increased from 795,163 in 2010 to 1,046,732 in 2020, making up 11.3% of the state’s total population or almost 1 in 10 New Jerseyans. This population growth (31.6%) represented the fastest rate among all major racial or ethnic groups between 2010 and 2020. In 2020, the three counties with the most Asian residents in New Jersey were Middlesex County (237,945), Bergen County (171,447), and Hudson County (133,509).
The five most populous Asian ethnic groups in New Jersey in 2020 were Indian (384,465), Chinese (150,891), Filipino (112,174), Korean (97,769), and Pakistani (33,033). Among these ethnic groups, Burmese experienced the fastest growth (50.8%), followed by Sri Lankan (44.0%) and Nepalese (37.3%). However, other Asian ethnic populations faced population declines from 2015 to 2020, including Vietnamese (-25.4%), Thai (-21.7%), Bangladeshi (-7.1%), Filipinos (-5.6%), and Koreans (-2.1%).
Note: While having higher growth rates, Burmese and Nepalese overall have smaller populations compared to the other Asian ethnic groups. See methodology for more detailed definitions of race/ethnicity categories and sources of data.
AGE DISTRIBUTION
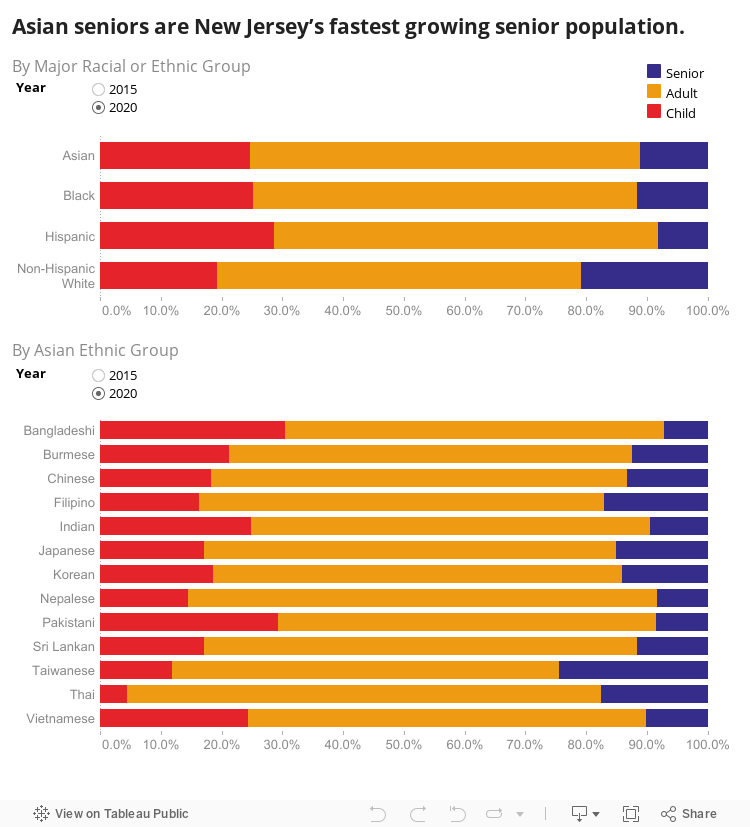
In 2020, children made up 24.8% of the total Asian population in New Jersey while 64.1% were adults and 11.2% were seniors. From 78,125 to 106,147, New Jersey’s senior Asian population experienced the highest growth (35.9%) among all major racial or ethnic groups from 2015 to 2020.
Among the Asian ethnic groups in this report, those with the highest proportion of their population as children in 2020 were Bangladeshi (30.4%), Pakistani (29.2%), and Indian (24.9%). The Asian ethnic groups with the highest percentage of their population as seniors were Taiwanese (24.4%), Thai (17.5%), and Filipino (17.0%) communities. A majority of the Asian ethnic groups included in this report were experiencing growth in their senior populations.
Note: Children are defined as below 18 years old, adults are defined as between 18-64 years old and seniors are defined as 65 years and above.
IMMIGRATION AND CITIZENSHIP
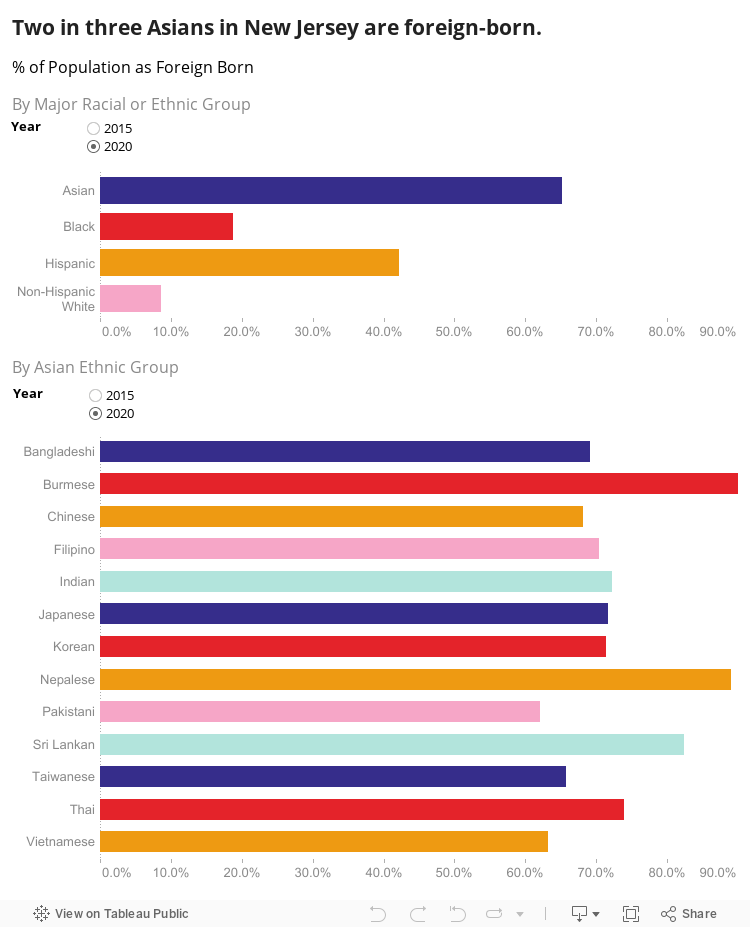
In 2020, 65.2% of the overall Asian population in New Jersey was foreign-born, the highest among all major racial or ethnic groups. Across Asian ethnic groups, people born outside of the United States represented a significant proportion of the population. The percentage of foreign-born people was highest among Burmese (90.8%) and Nepalese (89.0%). Across the majority of Asian ethnic groups, however, the general trend in New Jersey is that the foreign-born population is decreasing.
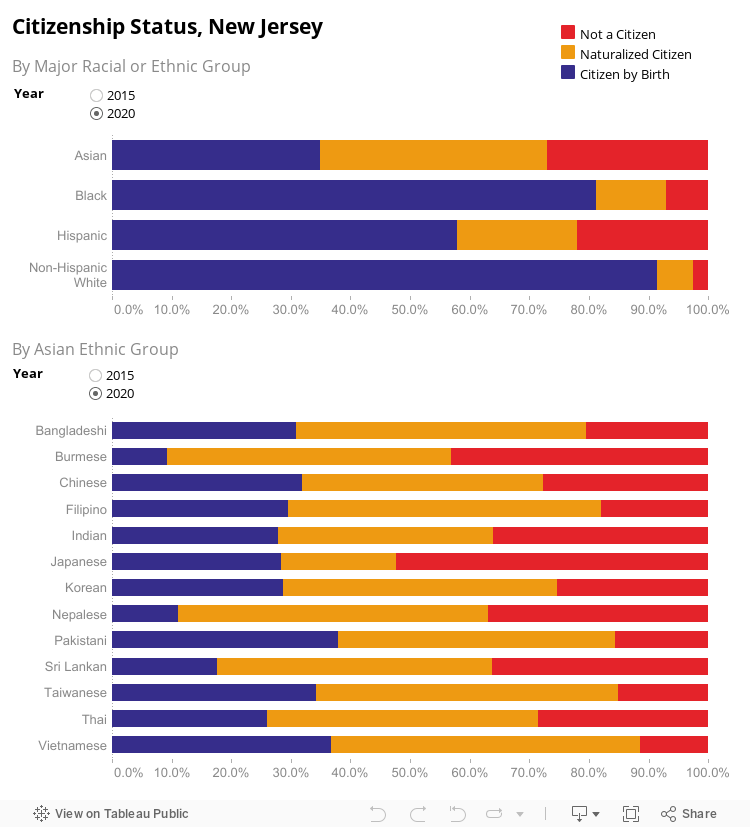
In 2020, Asians had the highest percentage of non-citizens (27.0%) out of all major racial or ethnic groups. Among Asian ethnic groups included in this report, Vietnamese had the highest citizen rate at 88.5%, and Japanese had the lowest citizen rate at 47.6%.
Note: The foreign-born population includes anyone who is not a U.S citizen at birth, including those who become U.S. citizens through naturalization. The native-born population includes anyone who is a U.S. citizen at birth.
EDUCATION
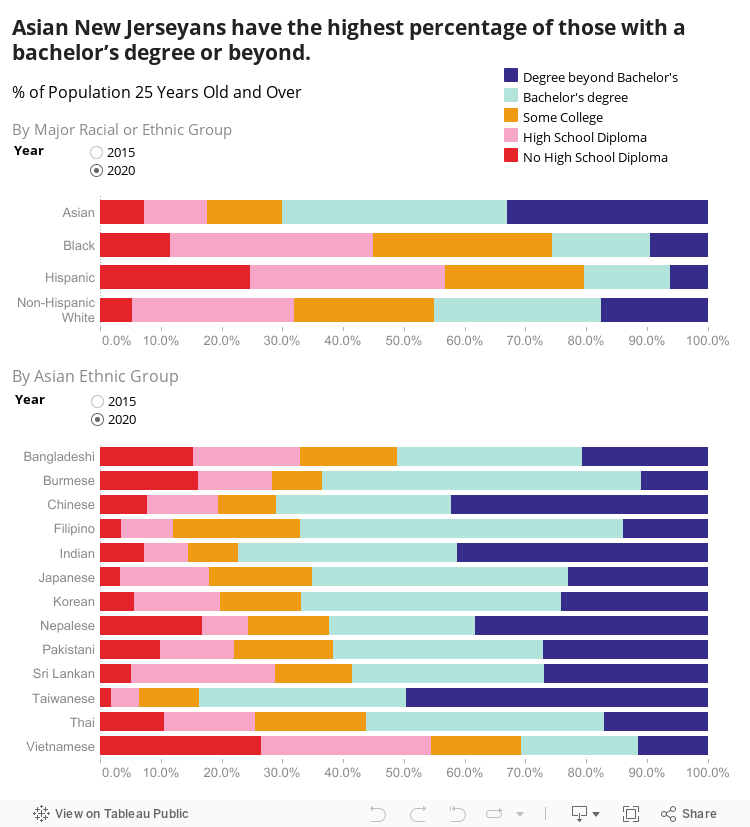
Among all major racial or ethnic groups in New Jersey, the Asian population in 2020 had the second lowest percentage of those without a high school diploma or equivalent at 7.3%, following the non-Hispanic White population at 5.3%. Asians also had the highest percentage of its population with a bachelor’s degree or degree beyond a bachelor’s (70.1%).
Compared to other Asian ethnic groups, the Vietnamese population had the highest percentage of people without a high school diploma (26.6%). The Indian population had the highest percentage of people with at least a bachelor’s degree (77.2%) while Taiwanese had the highest percentage of the population with a degree beyond a bachelor’s (49.7%). A majority of the Asian ethnic groups in this report experienced a decrease in the percentage of people without a high school diploma from 2015 to 2020.
ENGLISH PROFICIENCY
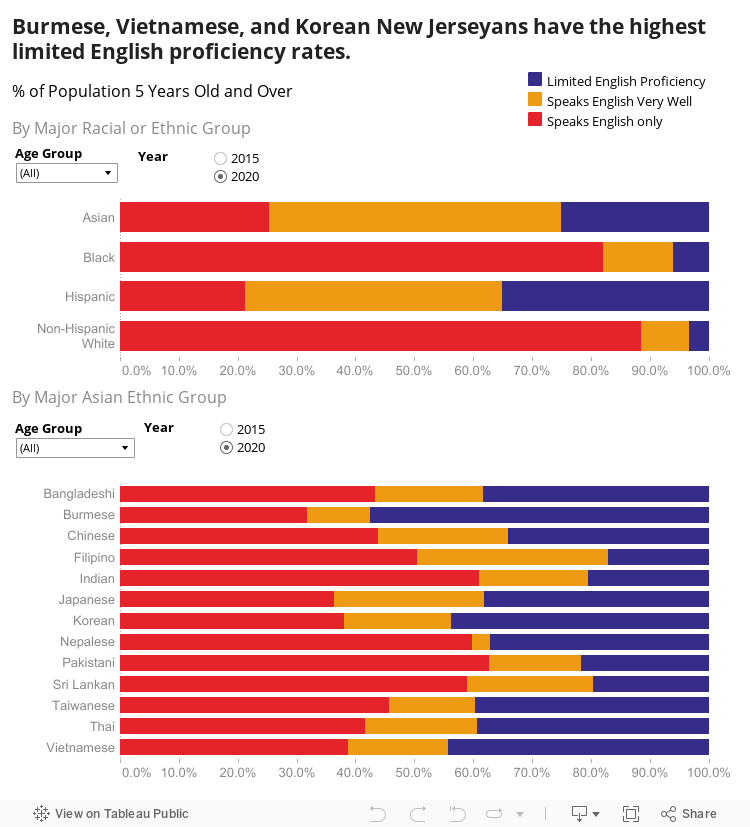
In 2020, 25.1% of the Asian American population over five years old had limited English proficiency (LEP). For Asian seniors, the LEP rate was much higher at 52.7%. Among Asian ethnic groups in this report, Burmese had the highest LEP rate (57.6%) followed by Vietnamese (44.3%) and Korean (43.8%).
Note: LEP stands for Limited English Proficiency. LEP individuals are those who speak English less than “very well.” “Speaks English Very Well” includes those who speak English very well and speak another language other than English.
EMPLOYMENT
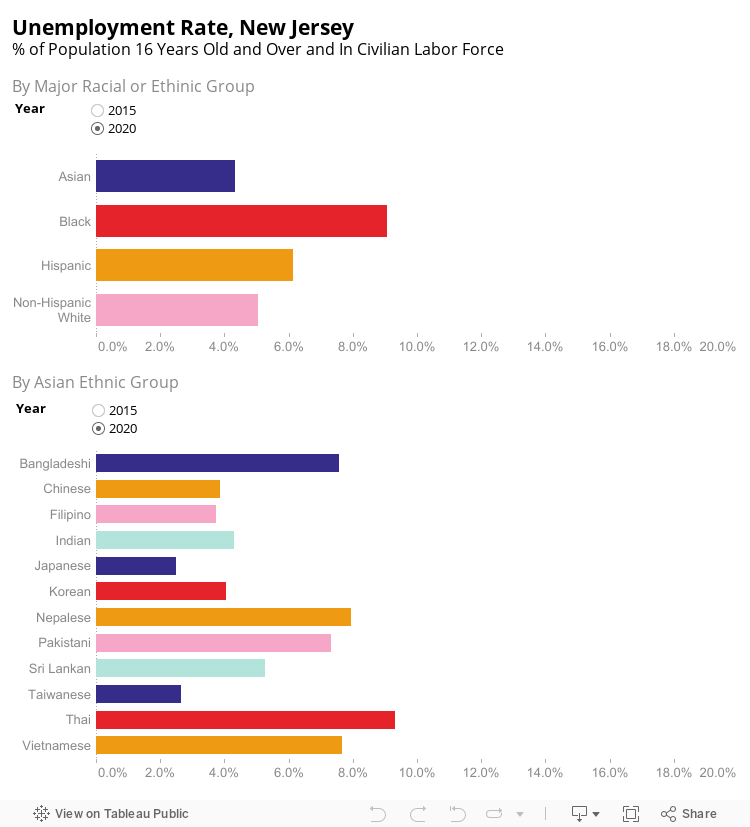
From 2015 to 2020, the unemployment rate for the Asian population decreased from 6.3% to 4.3%, which represented the lowest rate among major racial or ethnic groups in 2020. Within Asian ethnic groups, the Thai population had the highest unemployment rate (9.3%), followed by Nepalese (7.9%), Vietnamese (7.7%), Bangladeshi (7.6%), and Pakistani (7.3%).
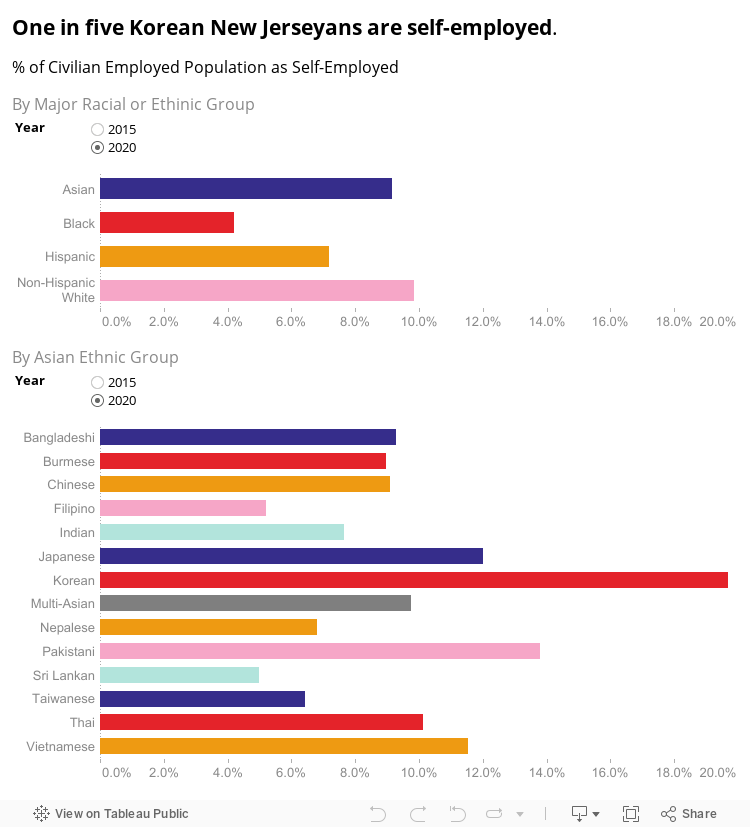
In 2020, 9.1% of the total Asian population identified themselves as self-employed. Among Asian ethnic groups, Koreans had the highest self-employment rate at 19.7% while Sri Lankans had the lowest self-employment rate at 5.0%.
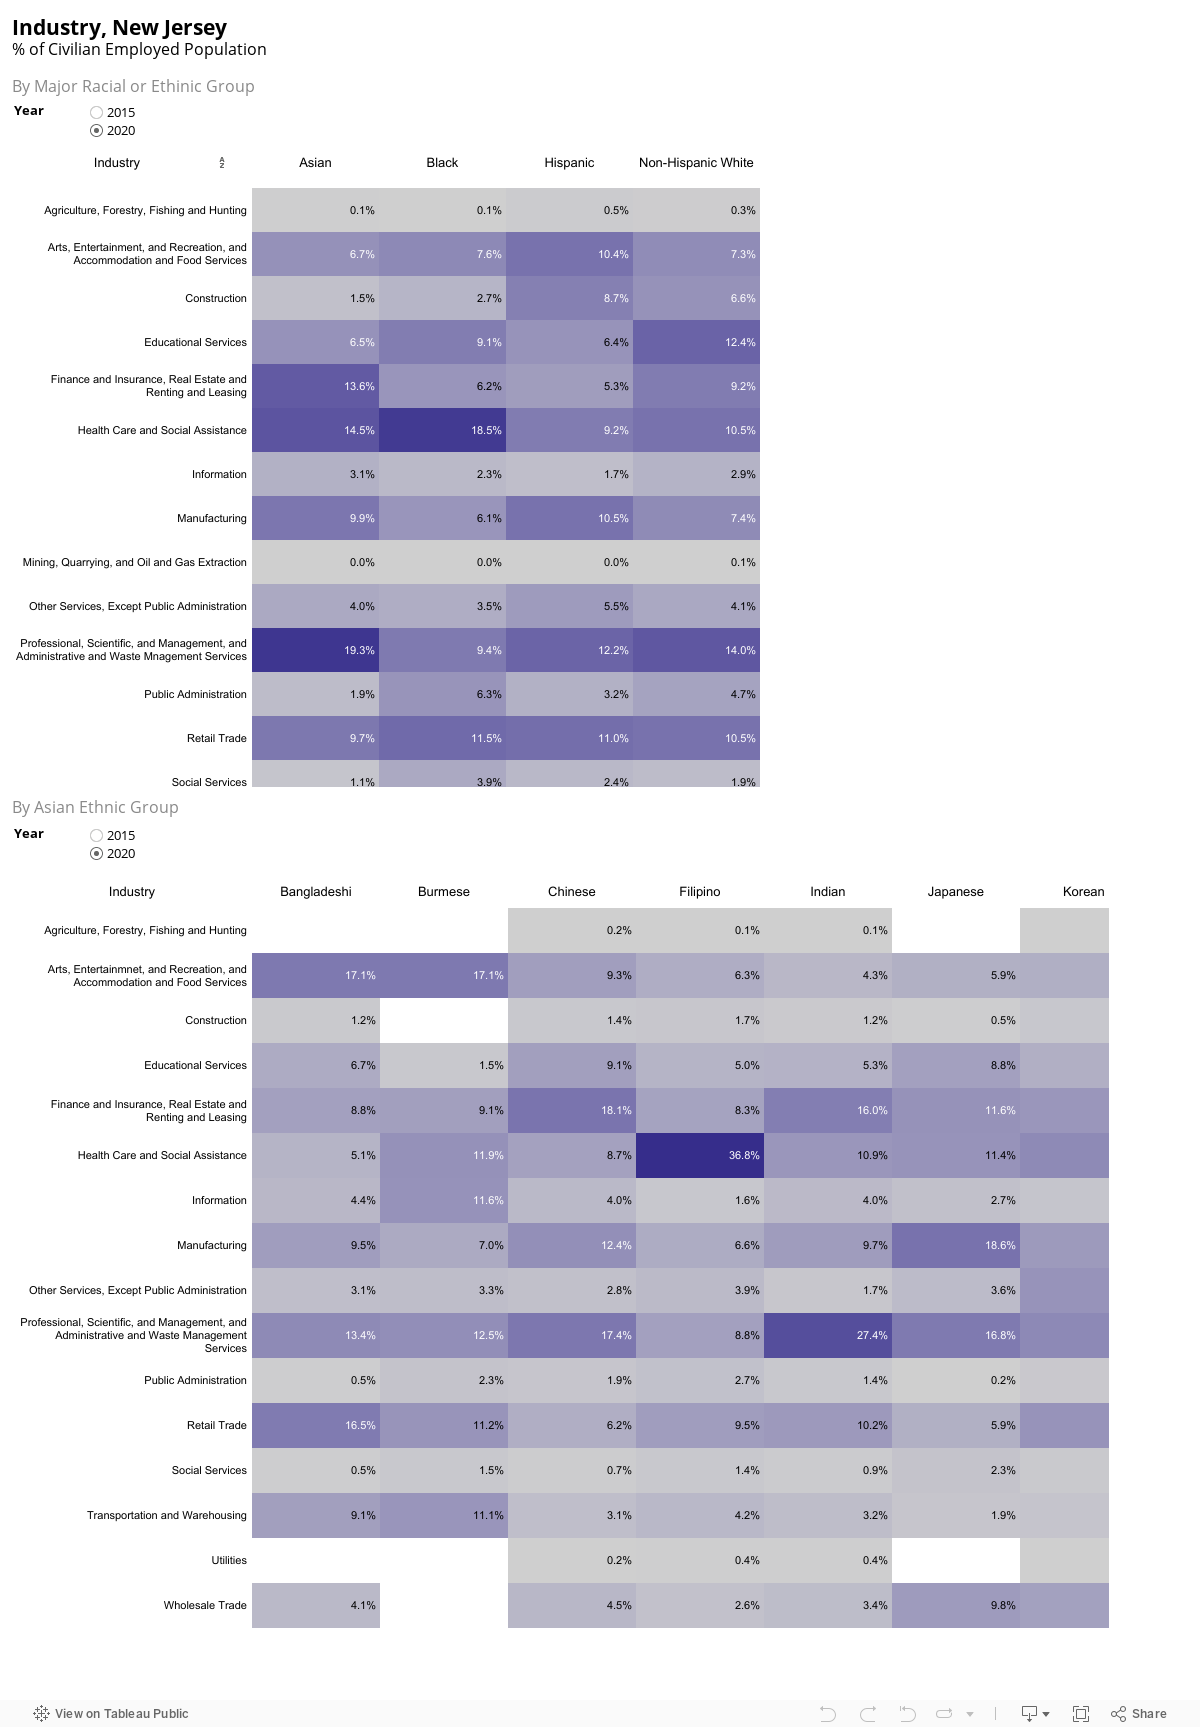
The top 5 industries for Asian Americans in New Jersey in 2020 were Professional, Scientific, Management and Administrative, Accounting, and Design Services (19.3%), Healthcare and Medical Industry (14.5%), Finance and Insurance, Real Estate, Renting, and Leasing (13.6%), Manufacturing (9.9%), and Retail Trade (9.7%).
INCOME AND POVERTY
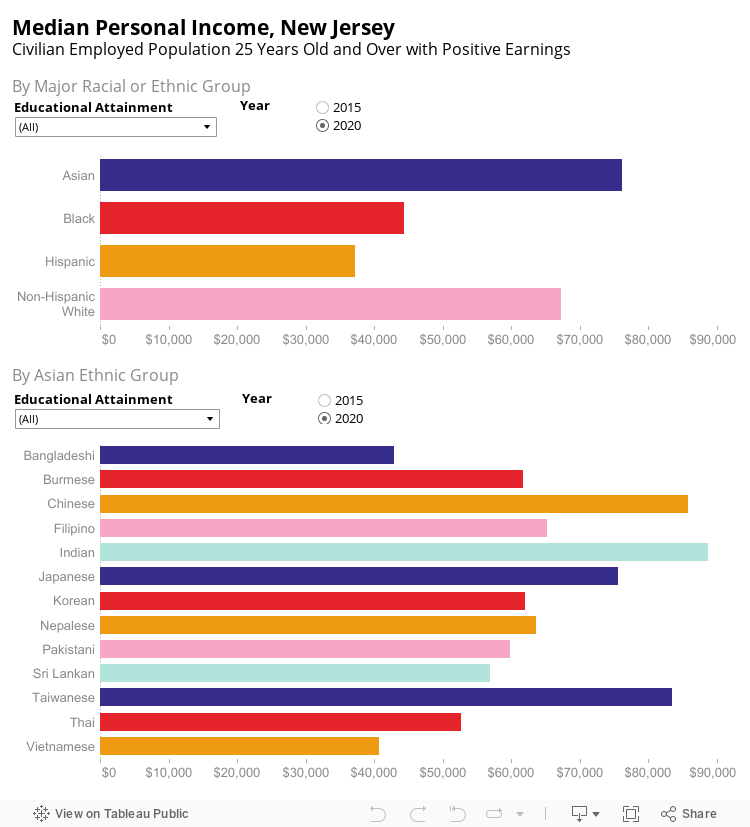
By 2020, the median personal income of civilian employed Asian Americans who were over 25 years old was $76,225, the highest among all major racial or ethnic groups. Compared to the median personal income ($62,823) of employed Asian Americans over 25 years old in 2015, this figure represented a 21.3% increase over 5 years. However, among those who did not have a high school diploma or equivalent, Asian Americans earned a median income of $27,559 in 2020—less than their non-Hispanic White counterparts’ median income of $32,725 that same year.
The top 3 ethnic groups with the highest personal median incomes in 2020 were Indian ($88,696), Chinese ($85,881), and Taiwanese ($83,527). Groups with lowest personal median incomes were Vietnamese ($40,707), Bangladeshi ($42,848), and Thai ($52,628).

As of 2020, the median household income for New Jersey was $85,120. The median Asian household income was $123,895, a 20% increase from 2015 ($103,241). Among the Asian ethnic groups included in this report, the Indian population had the highest median household income of $140,903 in 2020. The Pakistani population’s household median income had the highest growth from 2015 to 2020, increasing by 47.6% from $75,568 to $111,553. On the other hand, the Thai population experienced the greatest decline in household median income from 2015 to 2020, decreasing by 33.3% from $98,893 to $65,951 and falling below New Jersey’s overall median household income.
Note: Asian households are led by an Asian householder and can consist of non-Asian persons. Similarly, Chinese households are led by a Chinese householder and can consist of non-Chinese persons. Personal and Household incomes are adjusted for inflation.
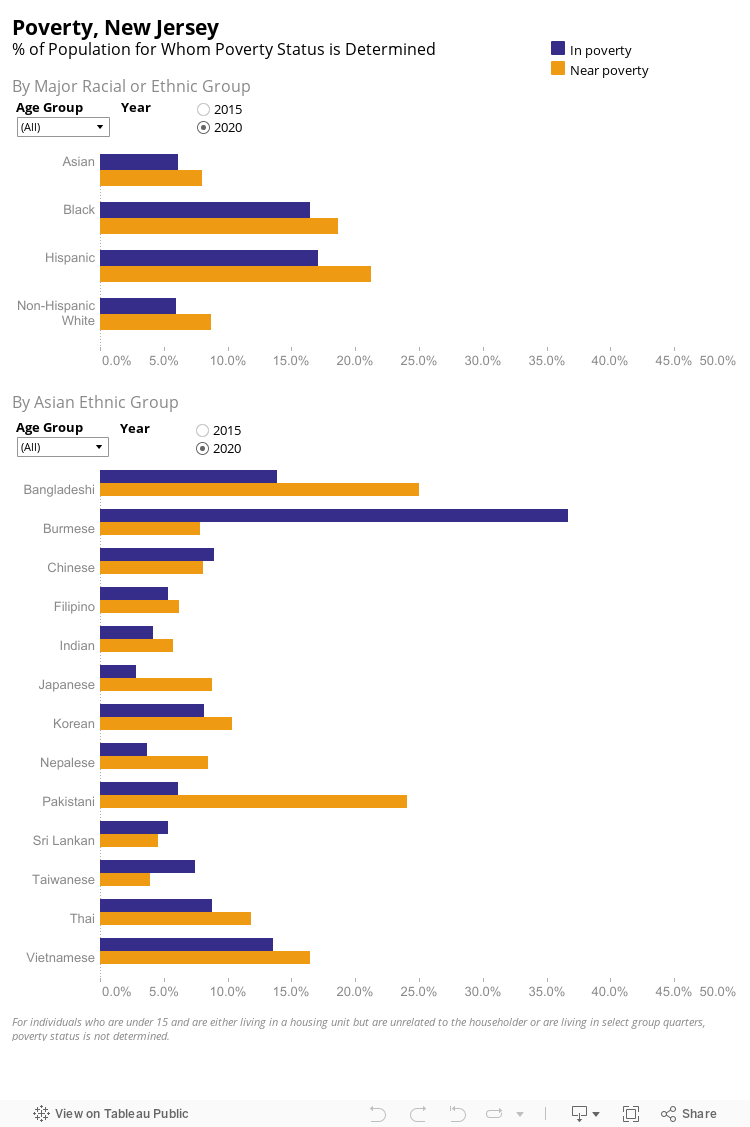
The Asian population had the second lowest poverty rate (6.2%) among major racial or ethnic groups in 2020, only slightly higher than that of the non-Hispanic White (6.0%) population. The Asian population also had the second lowest near-poverty rate (8.0%) in New Jersey. Both the poverty and near-poverty rates for Asians decreased from 2015 to 2020, a trend identified in all major racial or ethnic groups. Poverty rates were relatively low for Asian children (5.2%) and adults (5.8%); however, the senior poverty rate (10.1%) was significantly higher, suggesting that Asian seniors are a particularly vulnerable group.
Among the Asian ethnic groups in this report, Burmese had the highest poverty rate at 36.7%. Groups with the second and third highest poverty rates were, respectively, Bangladeshi (13.8%) and Vietnamese (13.5%) although these rates were considerably lower compared to that of the Burmese population.
Note: Poverty is defined as at or below 100% of the poverty threshold. Near poverty is defined as above 100% but below 200% of the poverty threshold. These two groups are exclusive to each other. Following the Office of Management and Budget’s (OMB) Statistical Policy Directive 14, the Census Bureau uses a set of money income thresholds that vary by family size and composition to determine poverty thresholds. The official poverty thresholds do not vary geographically, but they are updated for inflation using the Consumer Price Index (CPI-U). The official poverty definition uses money income before taxes and does not include capital gains or noncash benefits (such as public housing, Medicaid, and food stamps).
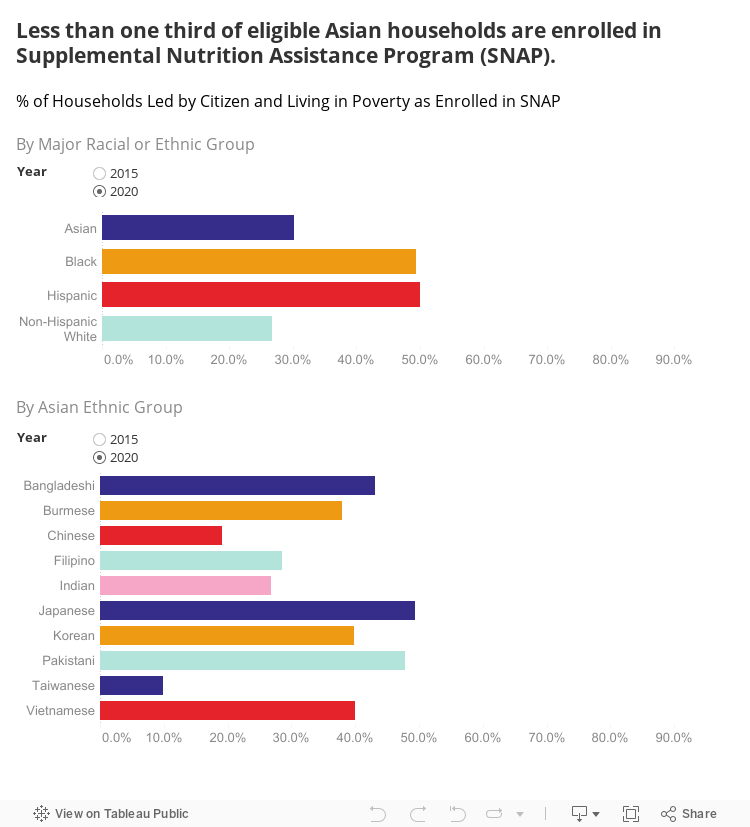
Only 30.3% of Asian households led by citizens and living below the federal poverty line were enrolled in SNAP in 2020, a rate much lower than those of their Black (49.4%) and Hispanic (50.1%) counterparts. Among Asian ethnic groups, those with the highest SNAP enrollment rates in 2020 were Japanese (49.3%), Pakistani (47.8%), and Bangladeshi (43.2%).
HEALTH INSURANCE
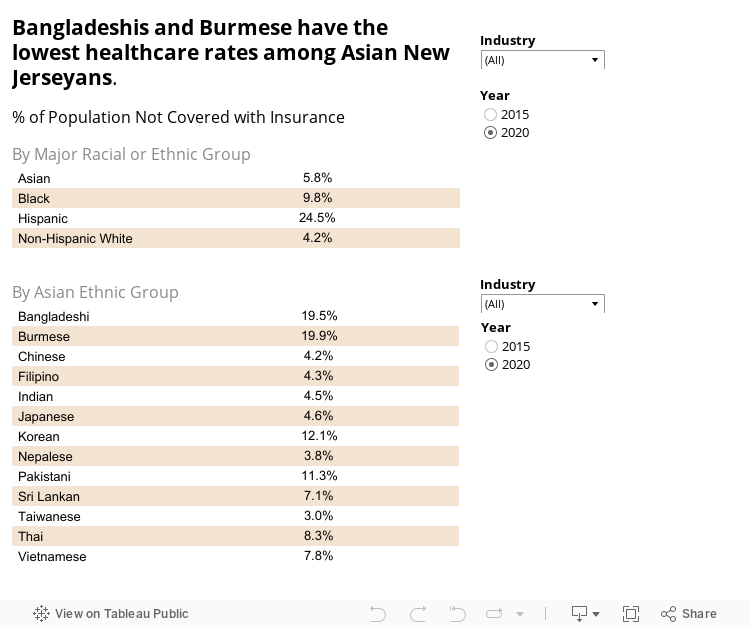
The Asian population in New Jersey had the second highest healthcare insurance coverage rate (94.2%) in 2020, a 6.3 percentage point increase from 2015. Healthcare insurance coverage rates remain high in most Asian ethnic groups. The four groups with coverage rates below 90% in 2020 were Pakistani (88.7%), Korean (87.9%), Bangladeshi (80.5%) and Burmese (80.1%).
HOUSING
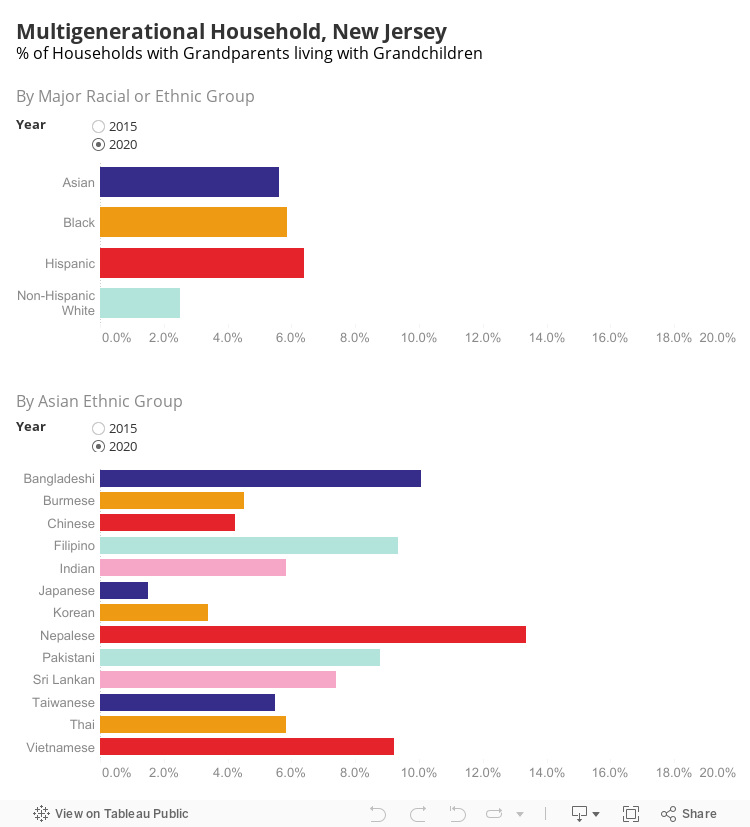
In 2020, 5.6% of Asian households in New Jersey were considered multigenerational households. Among the Asian ethnic groups included in this report, those with the highest percentage of multigenerational households in 2020 were Nepalese (13.3%), Bangladeshi (10.1%), and Vietnamese (9.2%). Japanese had the lowest multigenerational household percentage at 1.5%.
Note: Multigenerational households are defined as including two or more adult generations (with adults mainly ages 25 or older) or a “skipped generation,” which consists of grandparents and their grandchildren younger than 25.
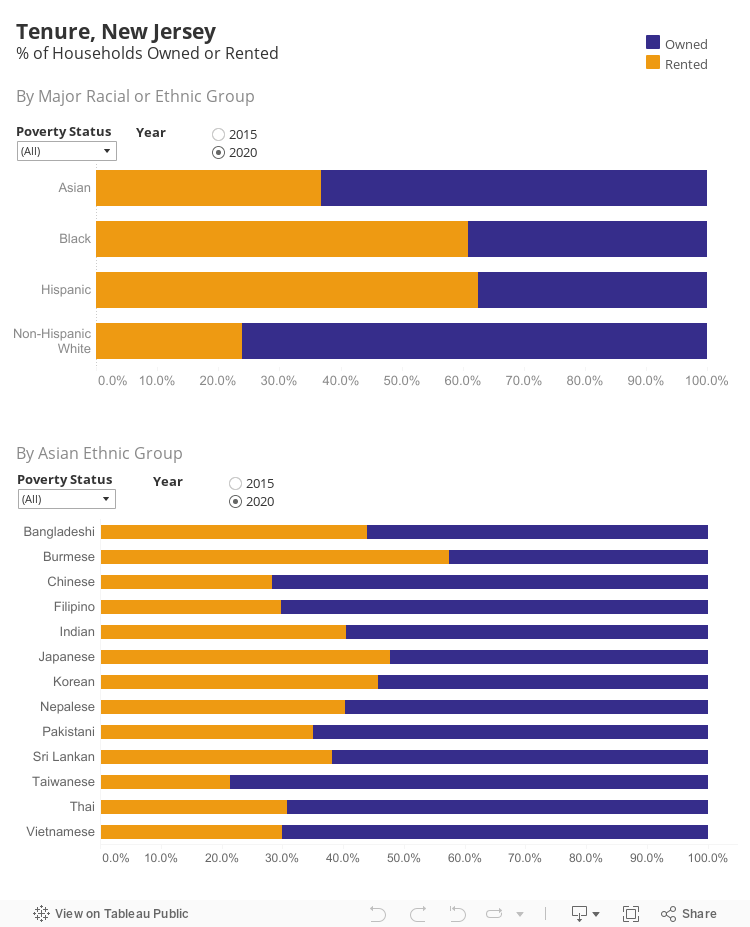
In 2020, 63.1% of Asian households in New Jersey owned their homes, the second highest among all major racial or ethnic groups. However, for Asian households living in poverty, the homeownership rate dropped to 31.9%. While the majority of Asian ethnic groups had high home ownership rates, the top 3 Asian ethnic groups with the highest homeownership rates were Taiwanese (78.7%), Chinese (71.6%), and Filipino (70.2%).
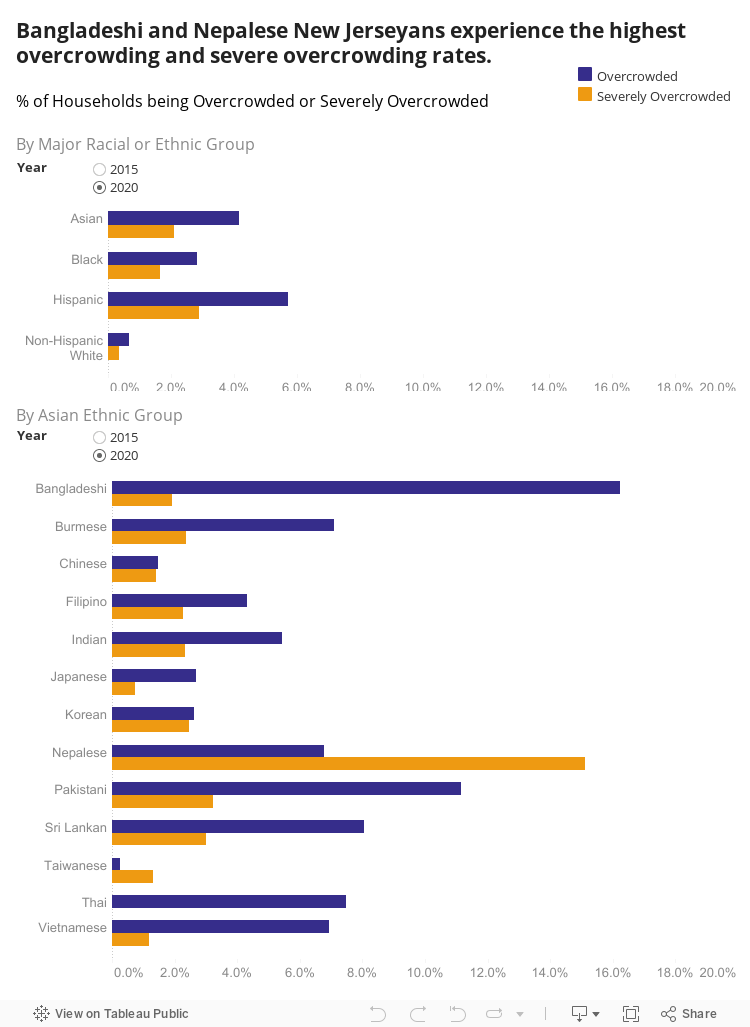
Most households did not experience overcrowding in New Jersey from 2015 to 2020. However, the Asian population had one of the highest overcrowding rates (4.2%) and severe overcrowding rates (2.1%) compared to other major racial or ethnic groups. Among Asian ethnic groups, the Bangladeshi population had the highest overcrowding rate (16.2%) and the Nepalese population had the highest severe overcrowding rate (15.1%). On the other end of the spectrum, Taiwanese had the lowest overcrowding rate (0.3%) and Japanese had the lowest severe overcrowding rate (0.7%).
Note: Overcrowding is defined as more than 1 person but less than 1.5 people per room in the housing unit. Severe overcrowding is defined as more than 1.5 people per room in the housing unit. The two groups are exclusive to each other.
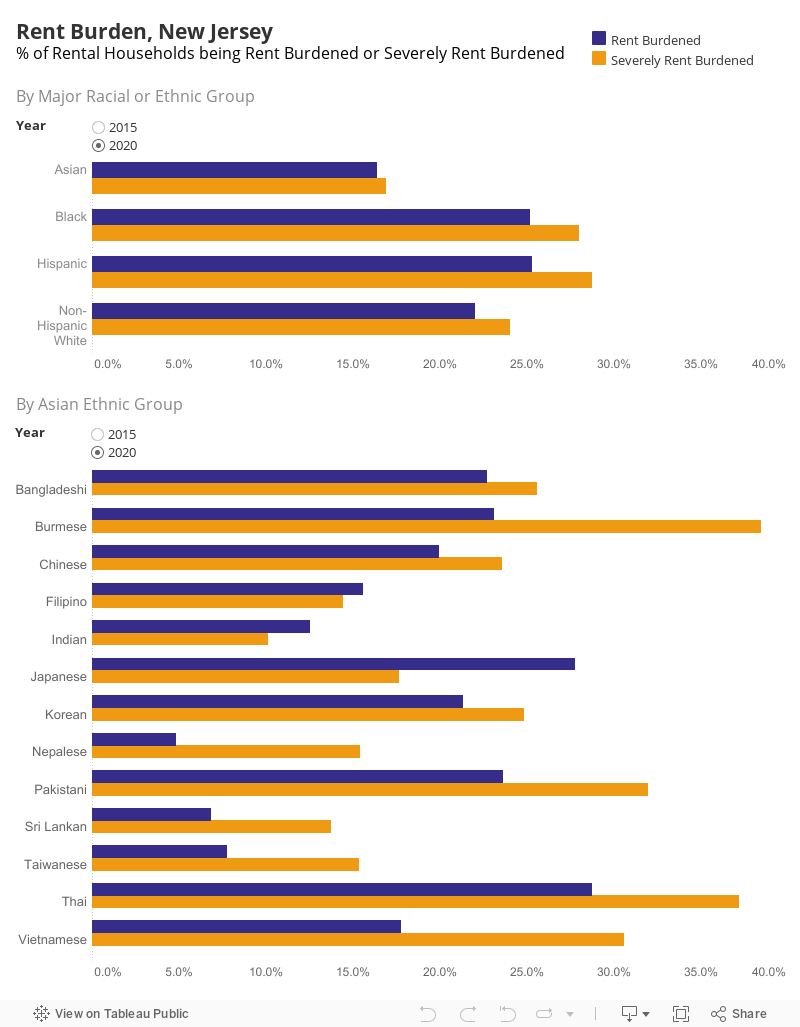
Rent burden was a concerning issue for New Jersey in 2020. 16.4% of Asian rental households in New Jersey were rent burdened as of that year, and another 16.9% were severely rent burdened.
NOTE: Households spending more than 30% but less than or equal to 50% of their income on rent are considered rent burdened. Severely burdened households spend over 50% of their income on rent.
CONCLUSION
As the fastest-growing major racial or ethnic group in New Jersey, the Asian population was a major contributor to the state’s overall population growth from 2010 to 2020. Areas with the highest number of Asian residents continued to attract more Asian Americans, with several counties even growing their Asian populations at faster rates than the state’s overall Asian population growth. With such demographic changes across the state, Asians are poised to influence New Jersey’s economic, social, and political landscape in the coming years.
Asians among the most economically divided major U.S. racial or ethnic groups
By providing a more comprehensive analysis of New Jersey’s Asian population and ethnic groups, this report offers an in-depth look at disparities within the state’s Asian communities. Although Asian households overall had the highest median household income when compared to the other major racial or ethnic groups in 2020, this does not tell the full story. Many Asian ethnic groups have been living in and near poverty at rates higher than other major racial or ethnic groups and, for some, the overall state population. For example, the poverty rates for Burmese (36.7%), Bangladeshi (13.8%), and Vietnamese (13.2%) were the highest among the Asian ethnic groups and surpassed the poverty rate for New Jersey’s overall population (9.5%), while the near poverty rates for Bangladeshi (24.9%), Pakistani (23.9%), and Vietnamese (16.0%) were higher than that of the state’s overall population (12.3%). Moreover, Asian ethnic groups with the highest in- and near-poverty rates also had some of the highest LEP rates, such as Burmese and Vietnamese communities with nearly half of their populations having LEP. It is crucial for policymakers to understand that Asian Americans are not a monolith and consider the role that challenges of limited language access on top of economic hardship play in affecting different Asian ethnic communities.
Asian seniors being left behind
The Asian senior population in New Jersey had the highest growth rate at 33.6% from 78,125 in 2015 to 106,147 in 2020 compared to other major racial or ethnic groups. Moreover, the Asian senior population in New Jersey was also faring worse socioeconomically compared to their counterparts in other major racial or ethnic groups. Asian seniors were the only major racial or ethnic senior group to experience an increase in their poverty rate, with a higher percentage of Asian seniors living in poverty in 2020 (10.0%) than in 2015 (8.4%). Additionally, 52.7% of Asian American seniors had limited English proficiency (LEP) in 2020, and the majority of seniors in most of the Asian ethnic groups included in this report also had limited English skills. A lack of accessible, in-language support only served to further isolate Asian American seniors who do not speak English well, preventing them from receiving necessary social services and, furthermore, excluding them from conversations about the Asian American community.
Impact of high housing costs on Asian Americans in New Jersey
As of 2020, a majority (63.1%) of Asian households in New Jersey owned the housing unit they resided in. However, rent burden was a widespread issue for many residents as 33.3% of Asian rental households were spending more than 30% of their income on rent. This trend presents a challenge to not only Asian Americans but also the overall population in New Jersey as the cost of rent continues to rise. Although overcrowding did not impact a majority of New Jersey’s population, the Asian population had one of the highest overcrowding rates (4.2%) and severe overcrowding rates (2.1%) compared to other major racial or ethnic groups. These numbers may be explained by the fact that many Asian communities come from cultural backgrounds in which living in multigenerational homes is the norm.