Asian Languages in New York City
PROFILE MATERIALS
KEY FINDINGS
As of 2020, the total population of Asian language speakers was 907,082 and 59% of them were considered LEP.
Among over 40 Asian languages spoken Citywide, 11 languages had over 50% of their speakers with LEP.
East Asian language-speaking populations tend to have higher LEP rates than South Asian language-speaking ones.
LEP Asian Americans were more likely to live in poverty and have lower education levels than their non-LEP counterparts.
Chinese speakers made up the greatest percentage of Asian language speakers as of 2020 (54%), followed by speakers of all South Asian languages combined (27%), and Korean speakers, who made up the third highest percentage (7%).
The majority (92%) of all Asian language speakers in New York City are those who speak one of the top 10 Asian languages.
Introduction
In recent decades, Asian Americans have been the fastest-growing racial and ethnic group in New York City. As of 2020, the Asian American population reached 1.5 million, accounting for more than 17% of the city’s population. Of the Asian Americans living in New York City, 66% were immigrants for whom English was not their first language. As a result, 45% of the Asian Americans in the city had Limited English Proficiency (LEP), meaning that they spoke English less than “very well,” and in turn had limited access to a variety of public and social services, such as health care, workforce development, and civic engagement.1
Moreover, Asian Americans are not a monolith. Asian Americans have the most ethnic diversity among other major racial groups because of their national origins and homeland identity, which is reflected in the myriad languages they speak. By focusing on the LEP population and their representation in the city and community districts, the AAF’s most recent brief aims to highlight the language needs of Asians in New York City using the most current American Community Survey (ACS) 5-year data by the Census Bureau.2
Asian Language Speakers with Limited English Proficiency
As of 2020, the total population of Asian language speakers was 907,082, which made up 59% of the total Asian American population in the city.3 And among the Asian language speakers, 59% or 535,073 of them had LEP. Figure 1 shows the LEP rate for the Asian languages spoken citywide. Among these Asian language groups, 11 had LEP rates above 50% – indicating that the majority of the population in these language groups had difficulty communicating effectively in English. We saw that East Asian language groups tended to have a higher LEP rate when compared to South Asian language groups.
Figure 1. Limited English Proficiency (LEP) Rate by Major Asian Language Groups, NYC, 2020
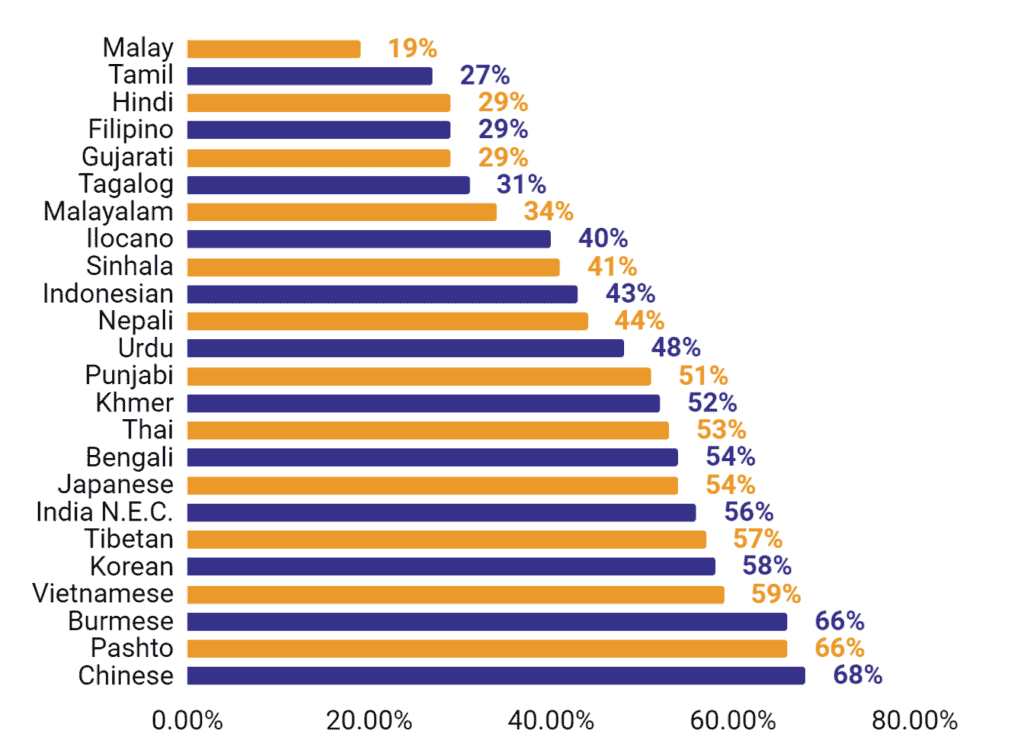
Chinese includes Mandarin, Cantonese, and Min Nan Chinese Speakers
Source: American Community Survey 2016-2020 5-year Data by Census Bureau
In 2020, 7% or 37,287 of LEP Asian Americans were children between ages 5 and 17, 71% or 391,069 were between ages 18 and 64, and about 22% or 122,624 of LEP Asian Americans were seniors.
Compared to the English-proficient population, the LEP population was less educated. As of 2020, 37% of LEP Asian Americans aged 25 and over had no high school diploma compared to 8% of their English-proficient counterparts. About 22% of LEP Asian adults over 25 years old had a bachelor’s degree or higher, compared to 67% of English proficiency Asian adults of the same age group.
LEP Asian Americans were more likely to live in poverty than English-proficient individuals. In 2020, 21% of LEP Asian Americans lived in households with an annual income below the federal poverty line – compared to 12% of English proficient Asian Americans.
Employed LEP Asian men in 2020 were more likely to work in restaurants and other food services, and the taxi and limousine service and construction industry than their English-proficient counterparts, while LEP Asian women were much more likely to be employed in restaurants and other food services and personal care services industries than their English-proficient counterparts.
Language Diversity
More than 40 different languages and dialects are spoken by Asian Americans in New York City. As the immigrant population continues to grow, it becomes more challenging, if not impossible, to fully represent their diverse language backgrounds without a more detailed and subdivided database of the Asian American population. With the most recent ACS data, we focus on the most commonly spoken Asian languages in New York City. Table 1 shows the top 10 Asian language groups that made up the majority (92%) of the total Asian language speakers in New York City.4
Table 1: Top 10 Asian Languages Spoken Citywide, NYC, 2020
| Language | Citywide Speakers | Percentage of Total Asian Language Speakers |
| Chinese* | 486,604 | 53.6% |
| Bengali | 110,320 | 12.2% |
| Korean | 64,353 | 7.1% |
| Urdu | 42,663 | 4.7% |
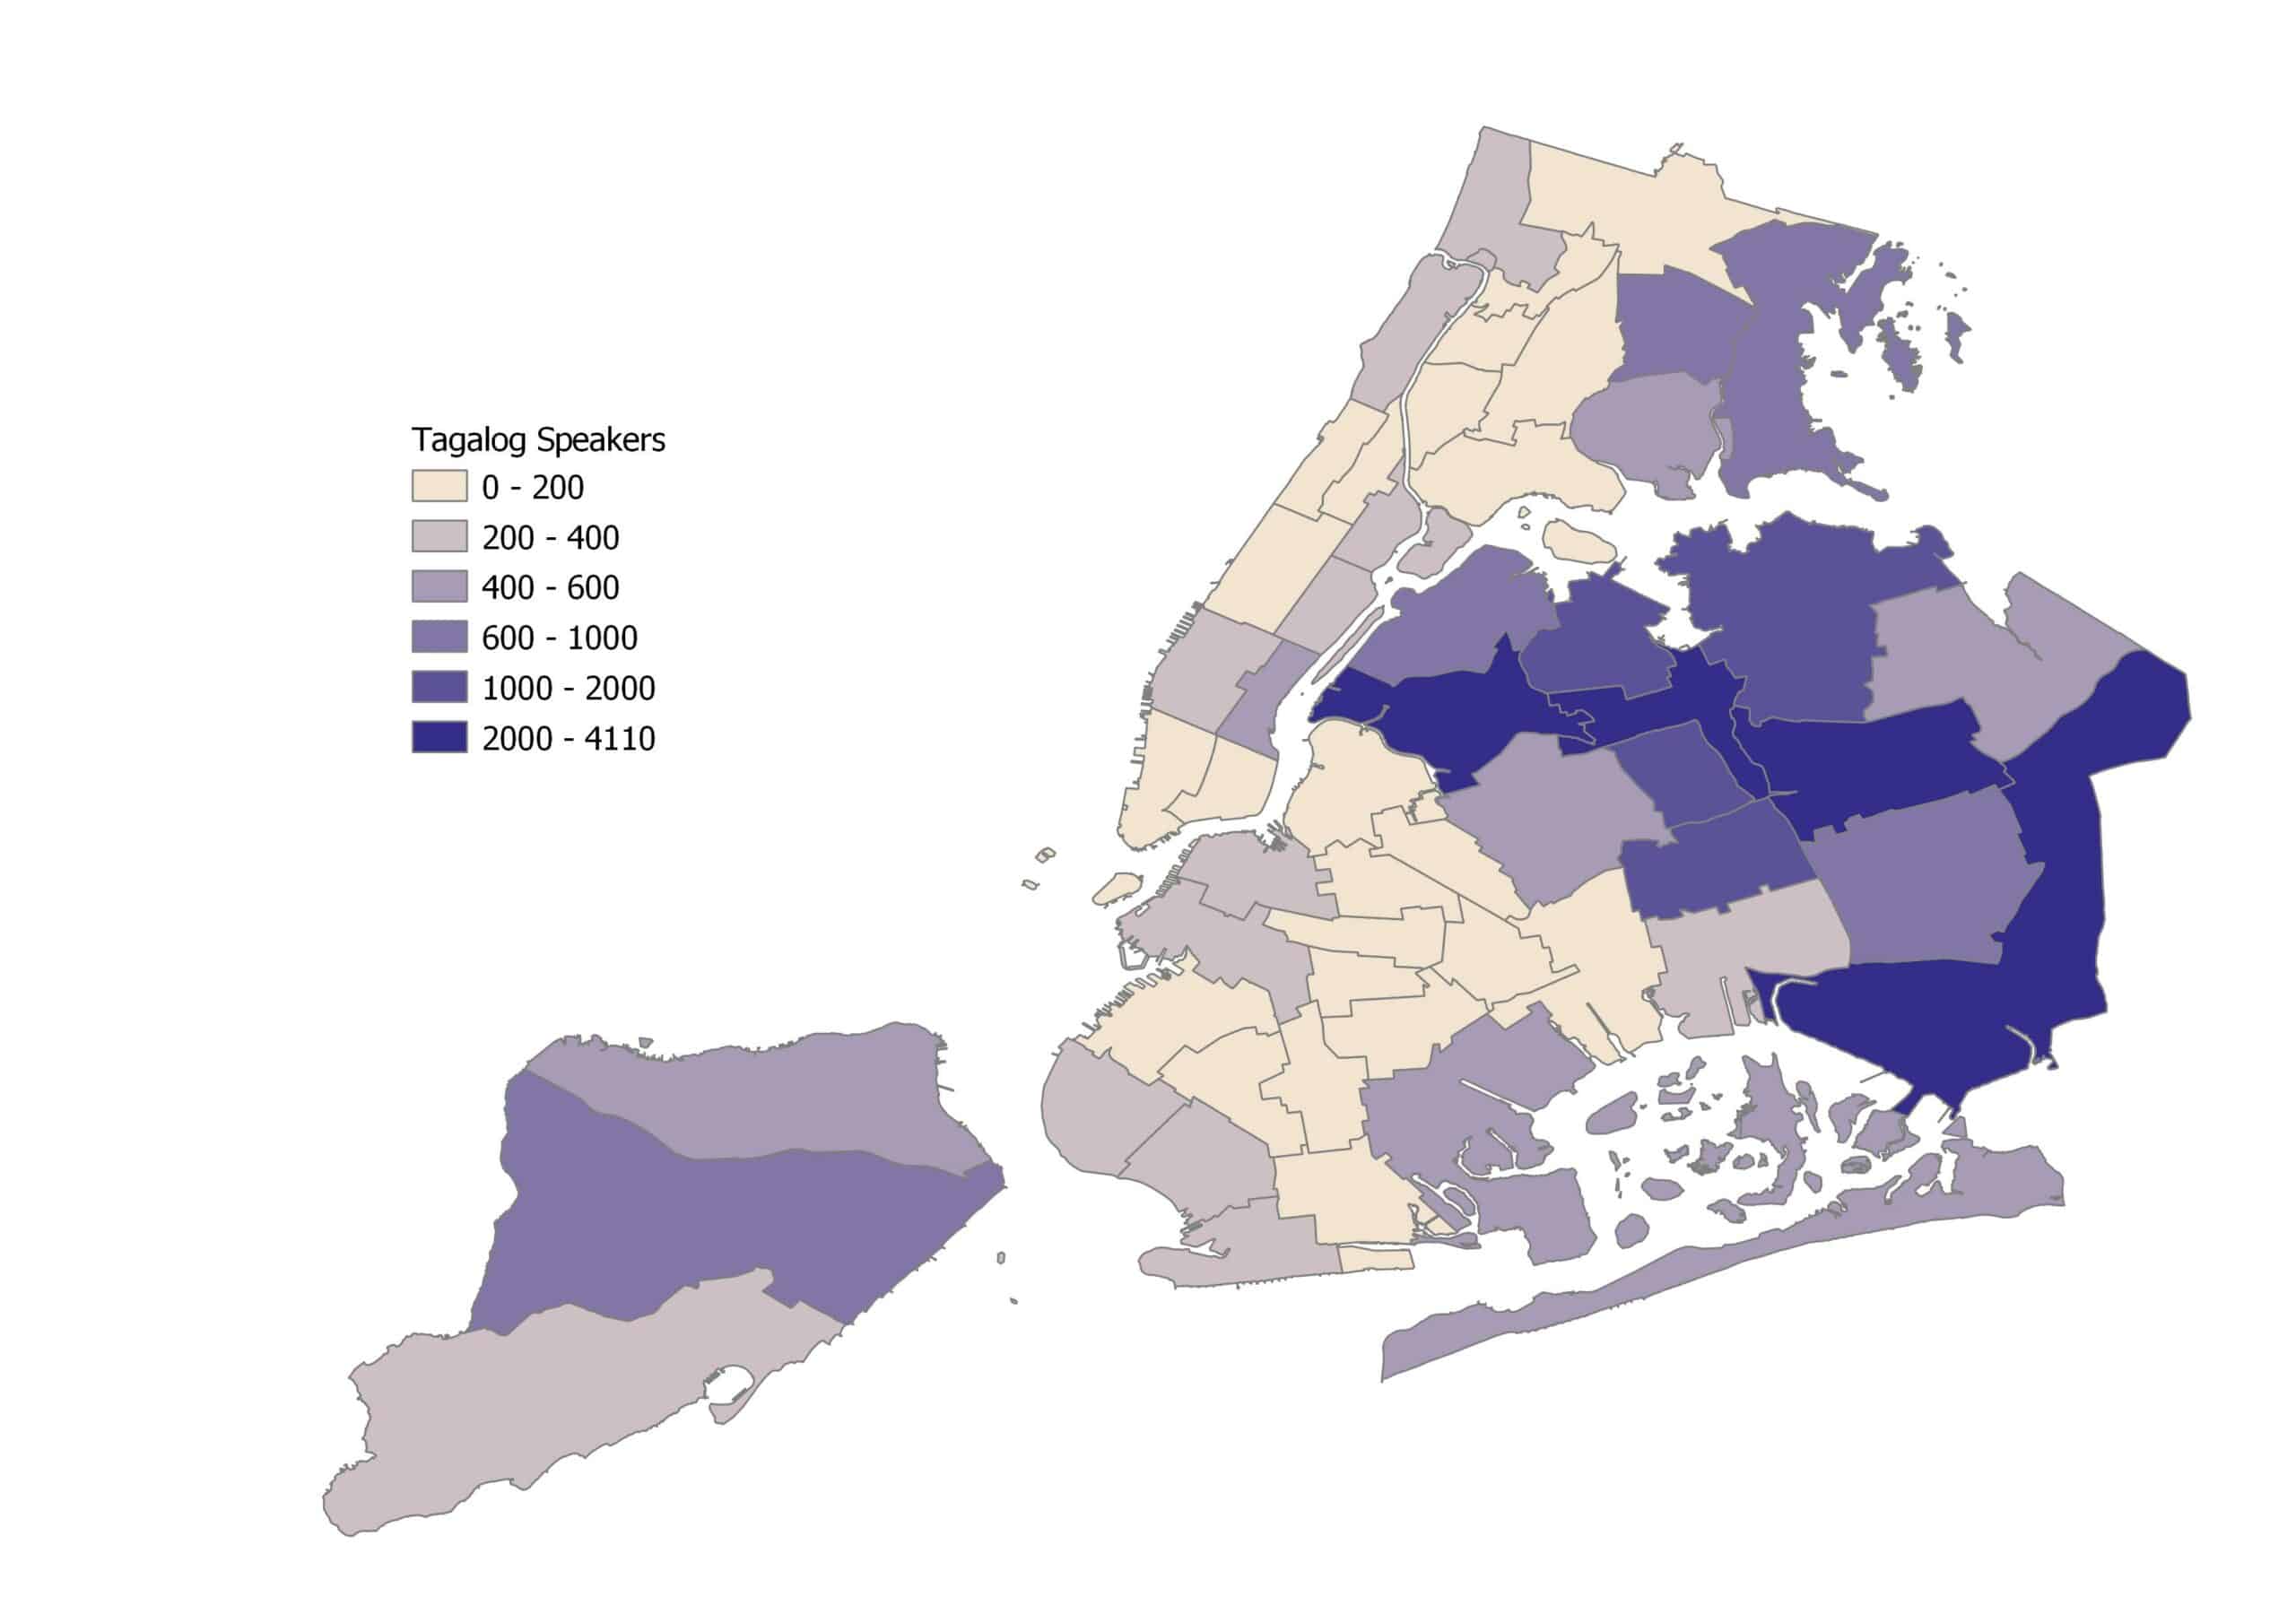
| Tagalog | 30,484 | 3.4% |
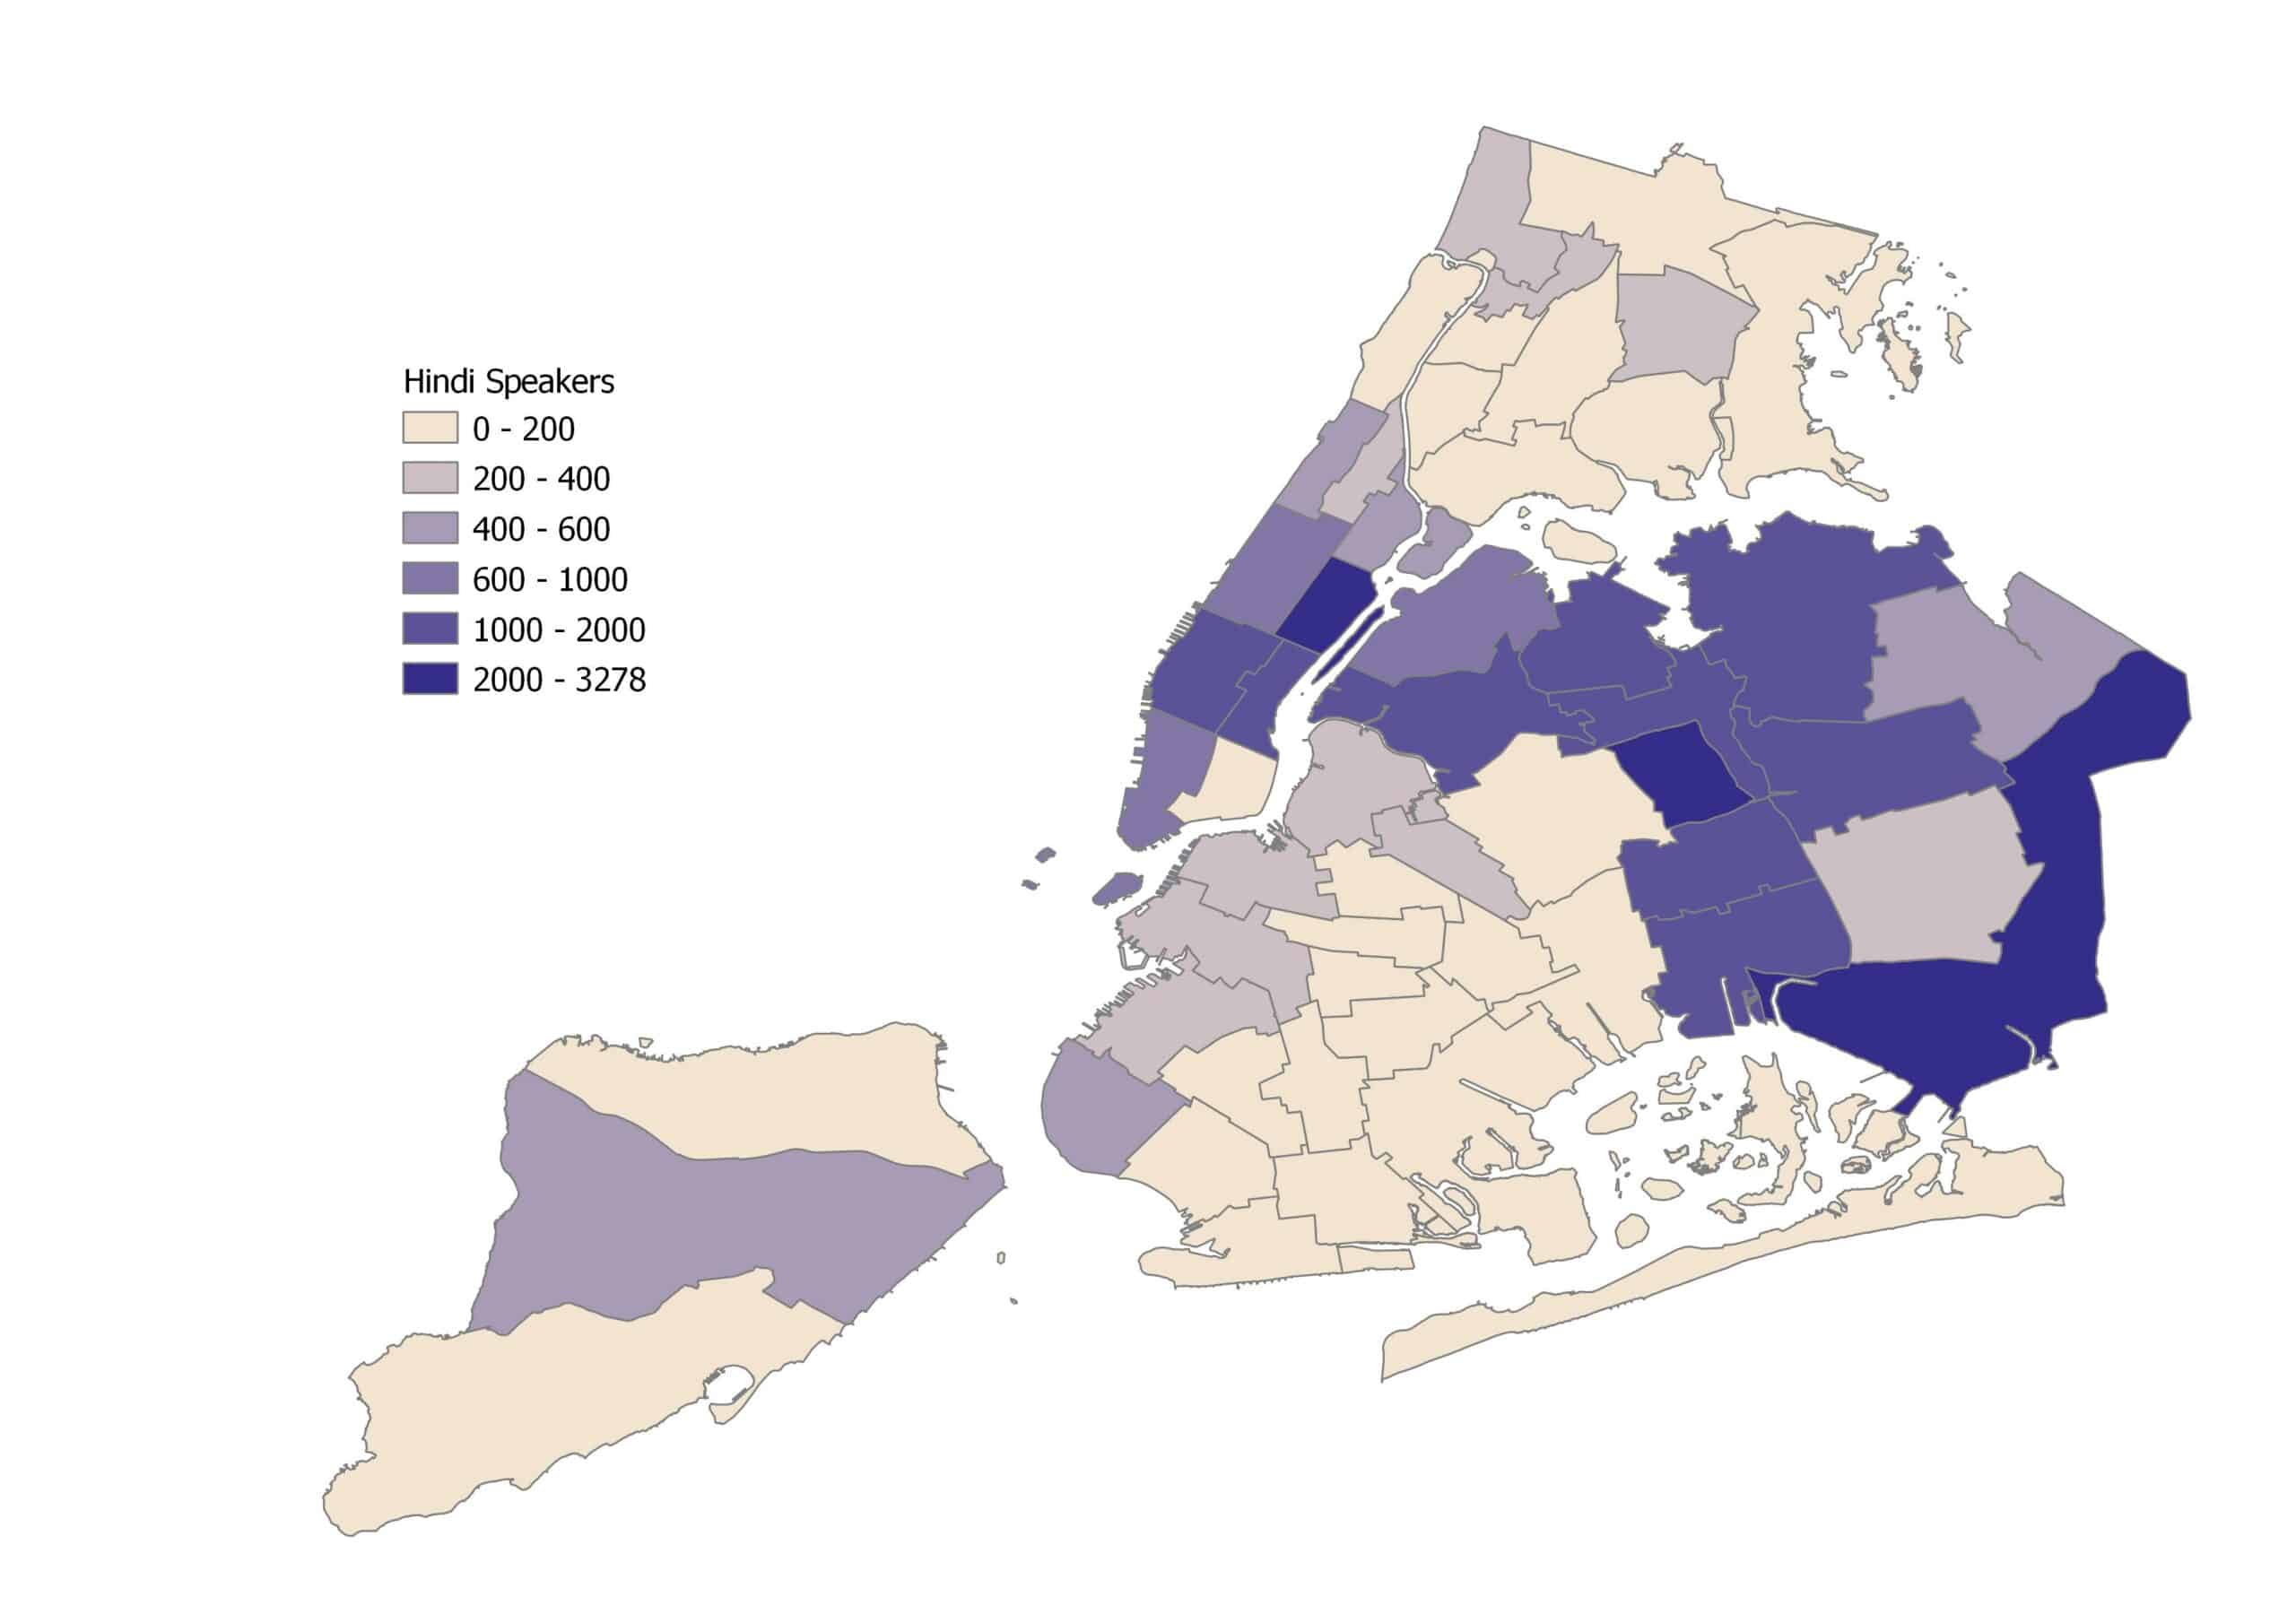
| Hindi | 30,188 | 3.3% |
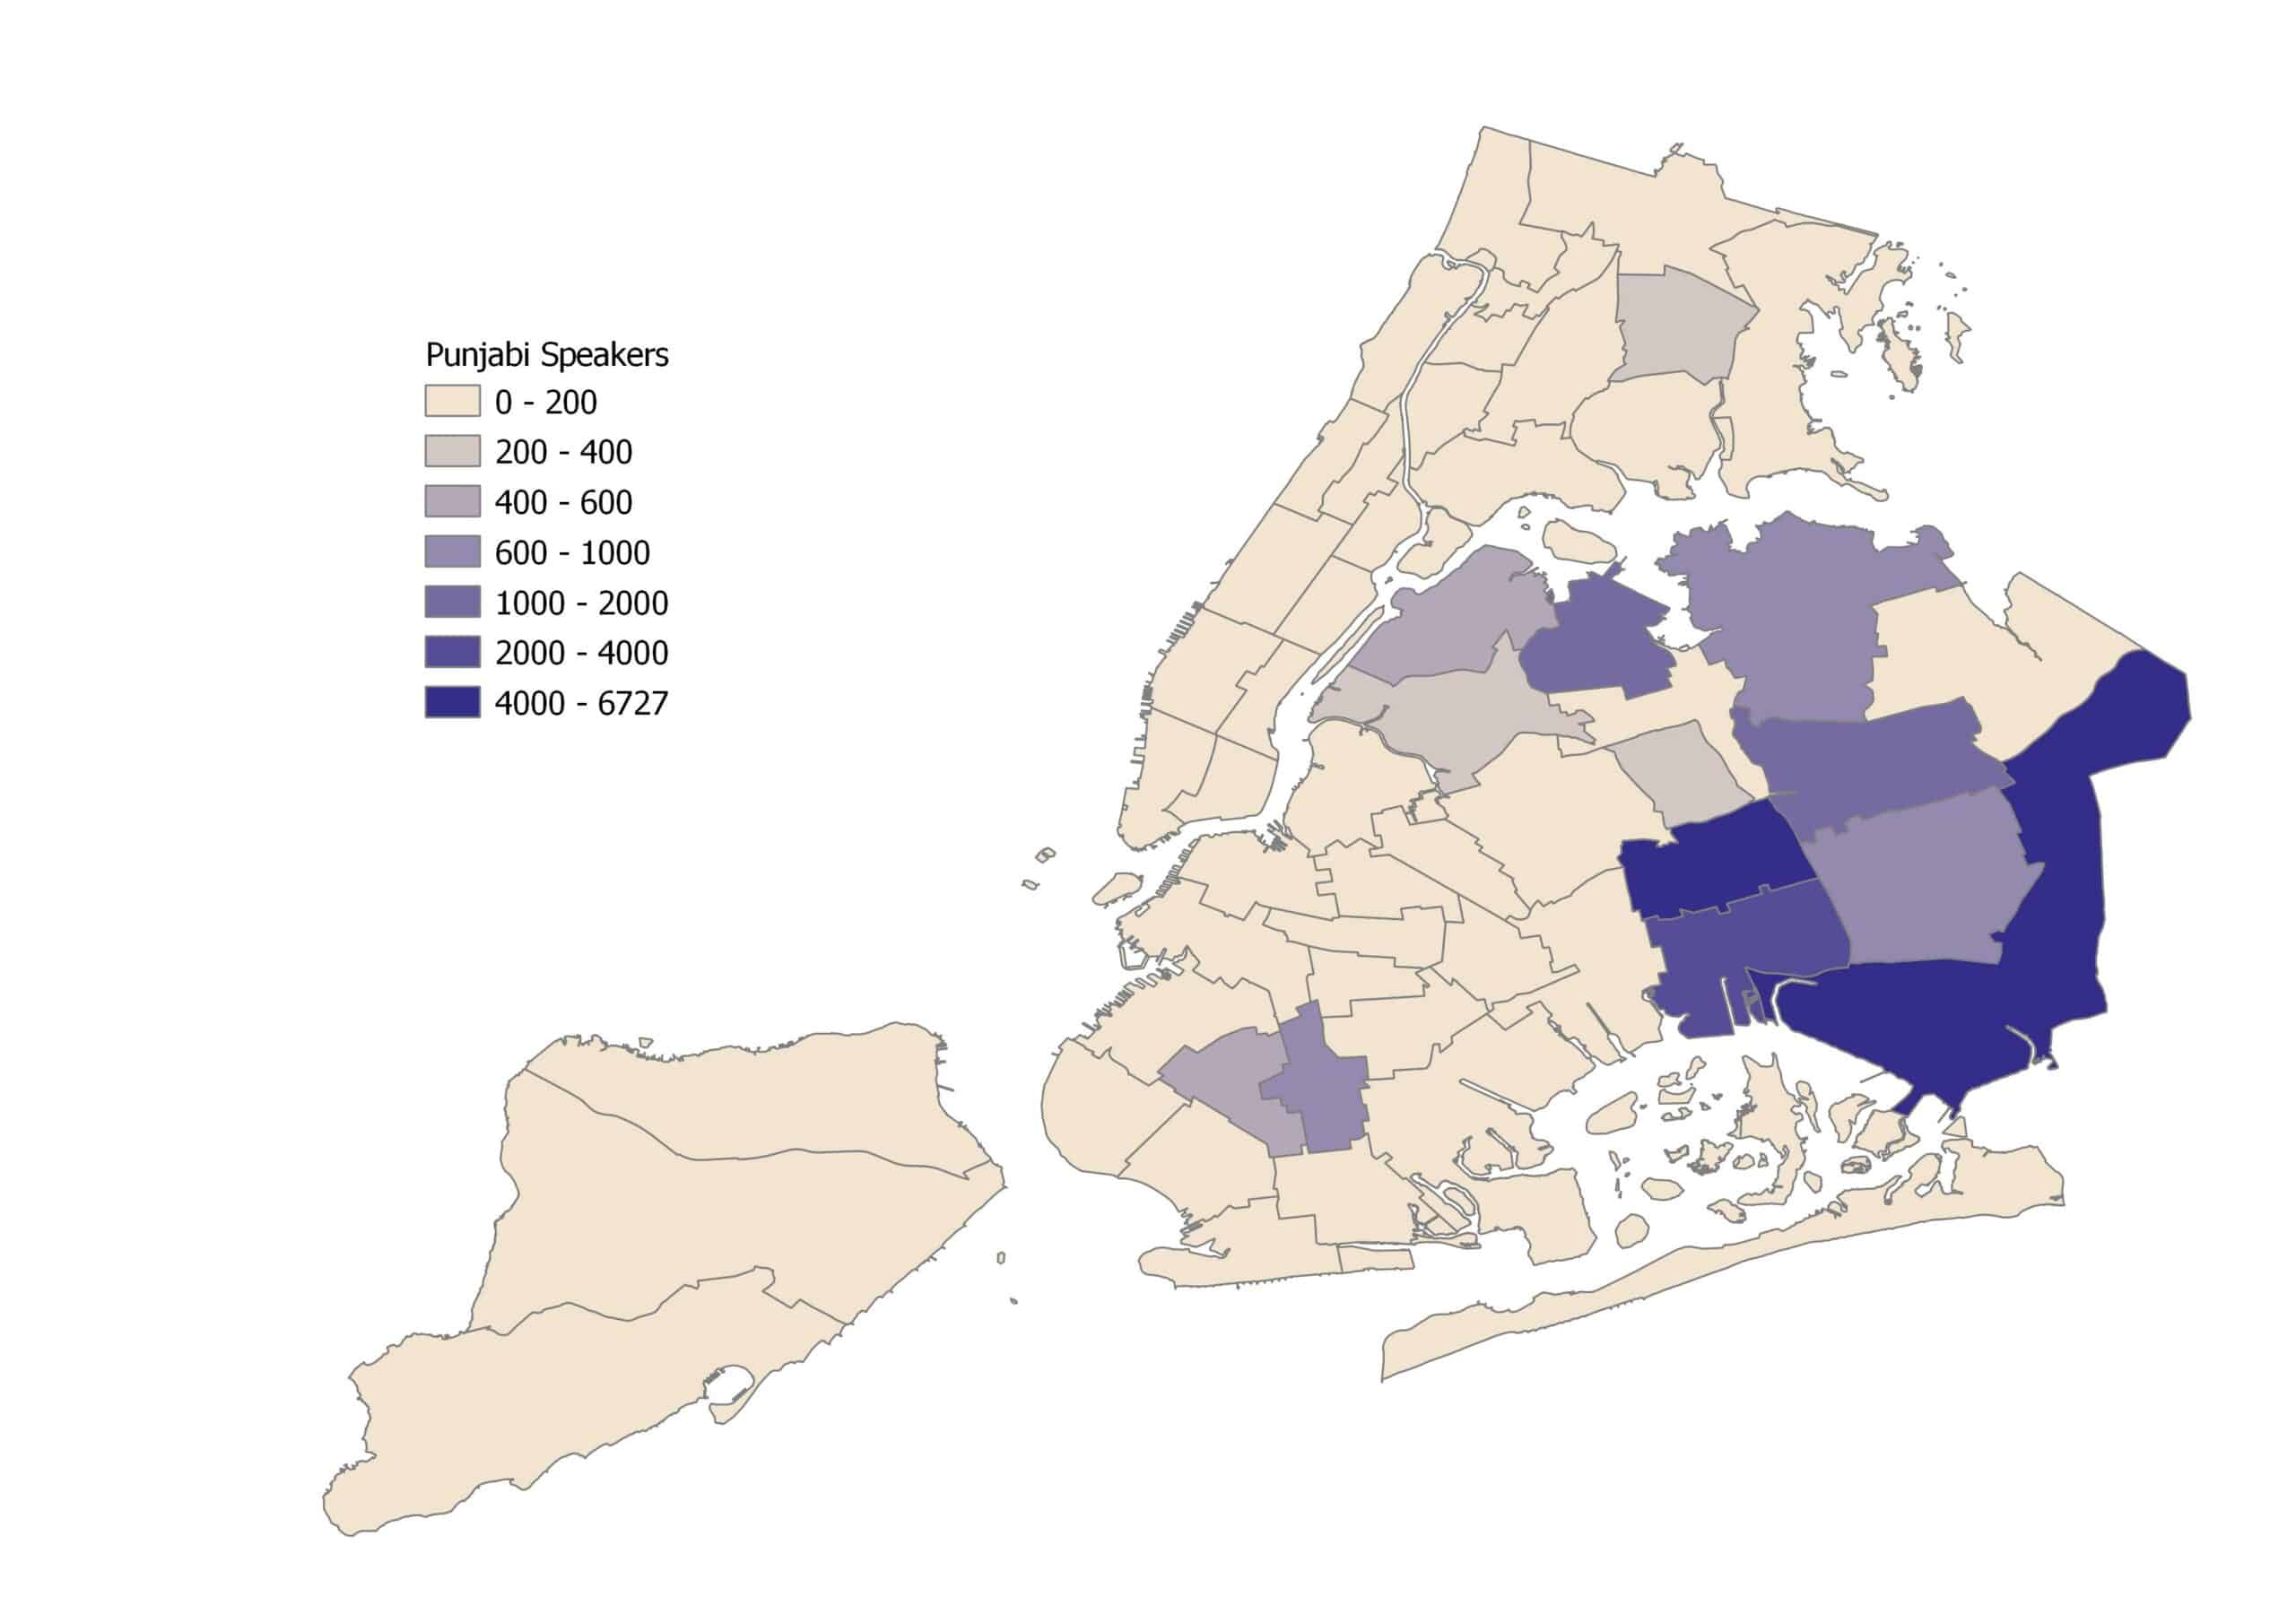
| Punjabi | 23,772 | 2.6% |
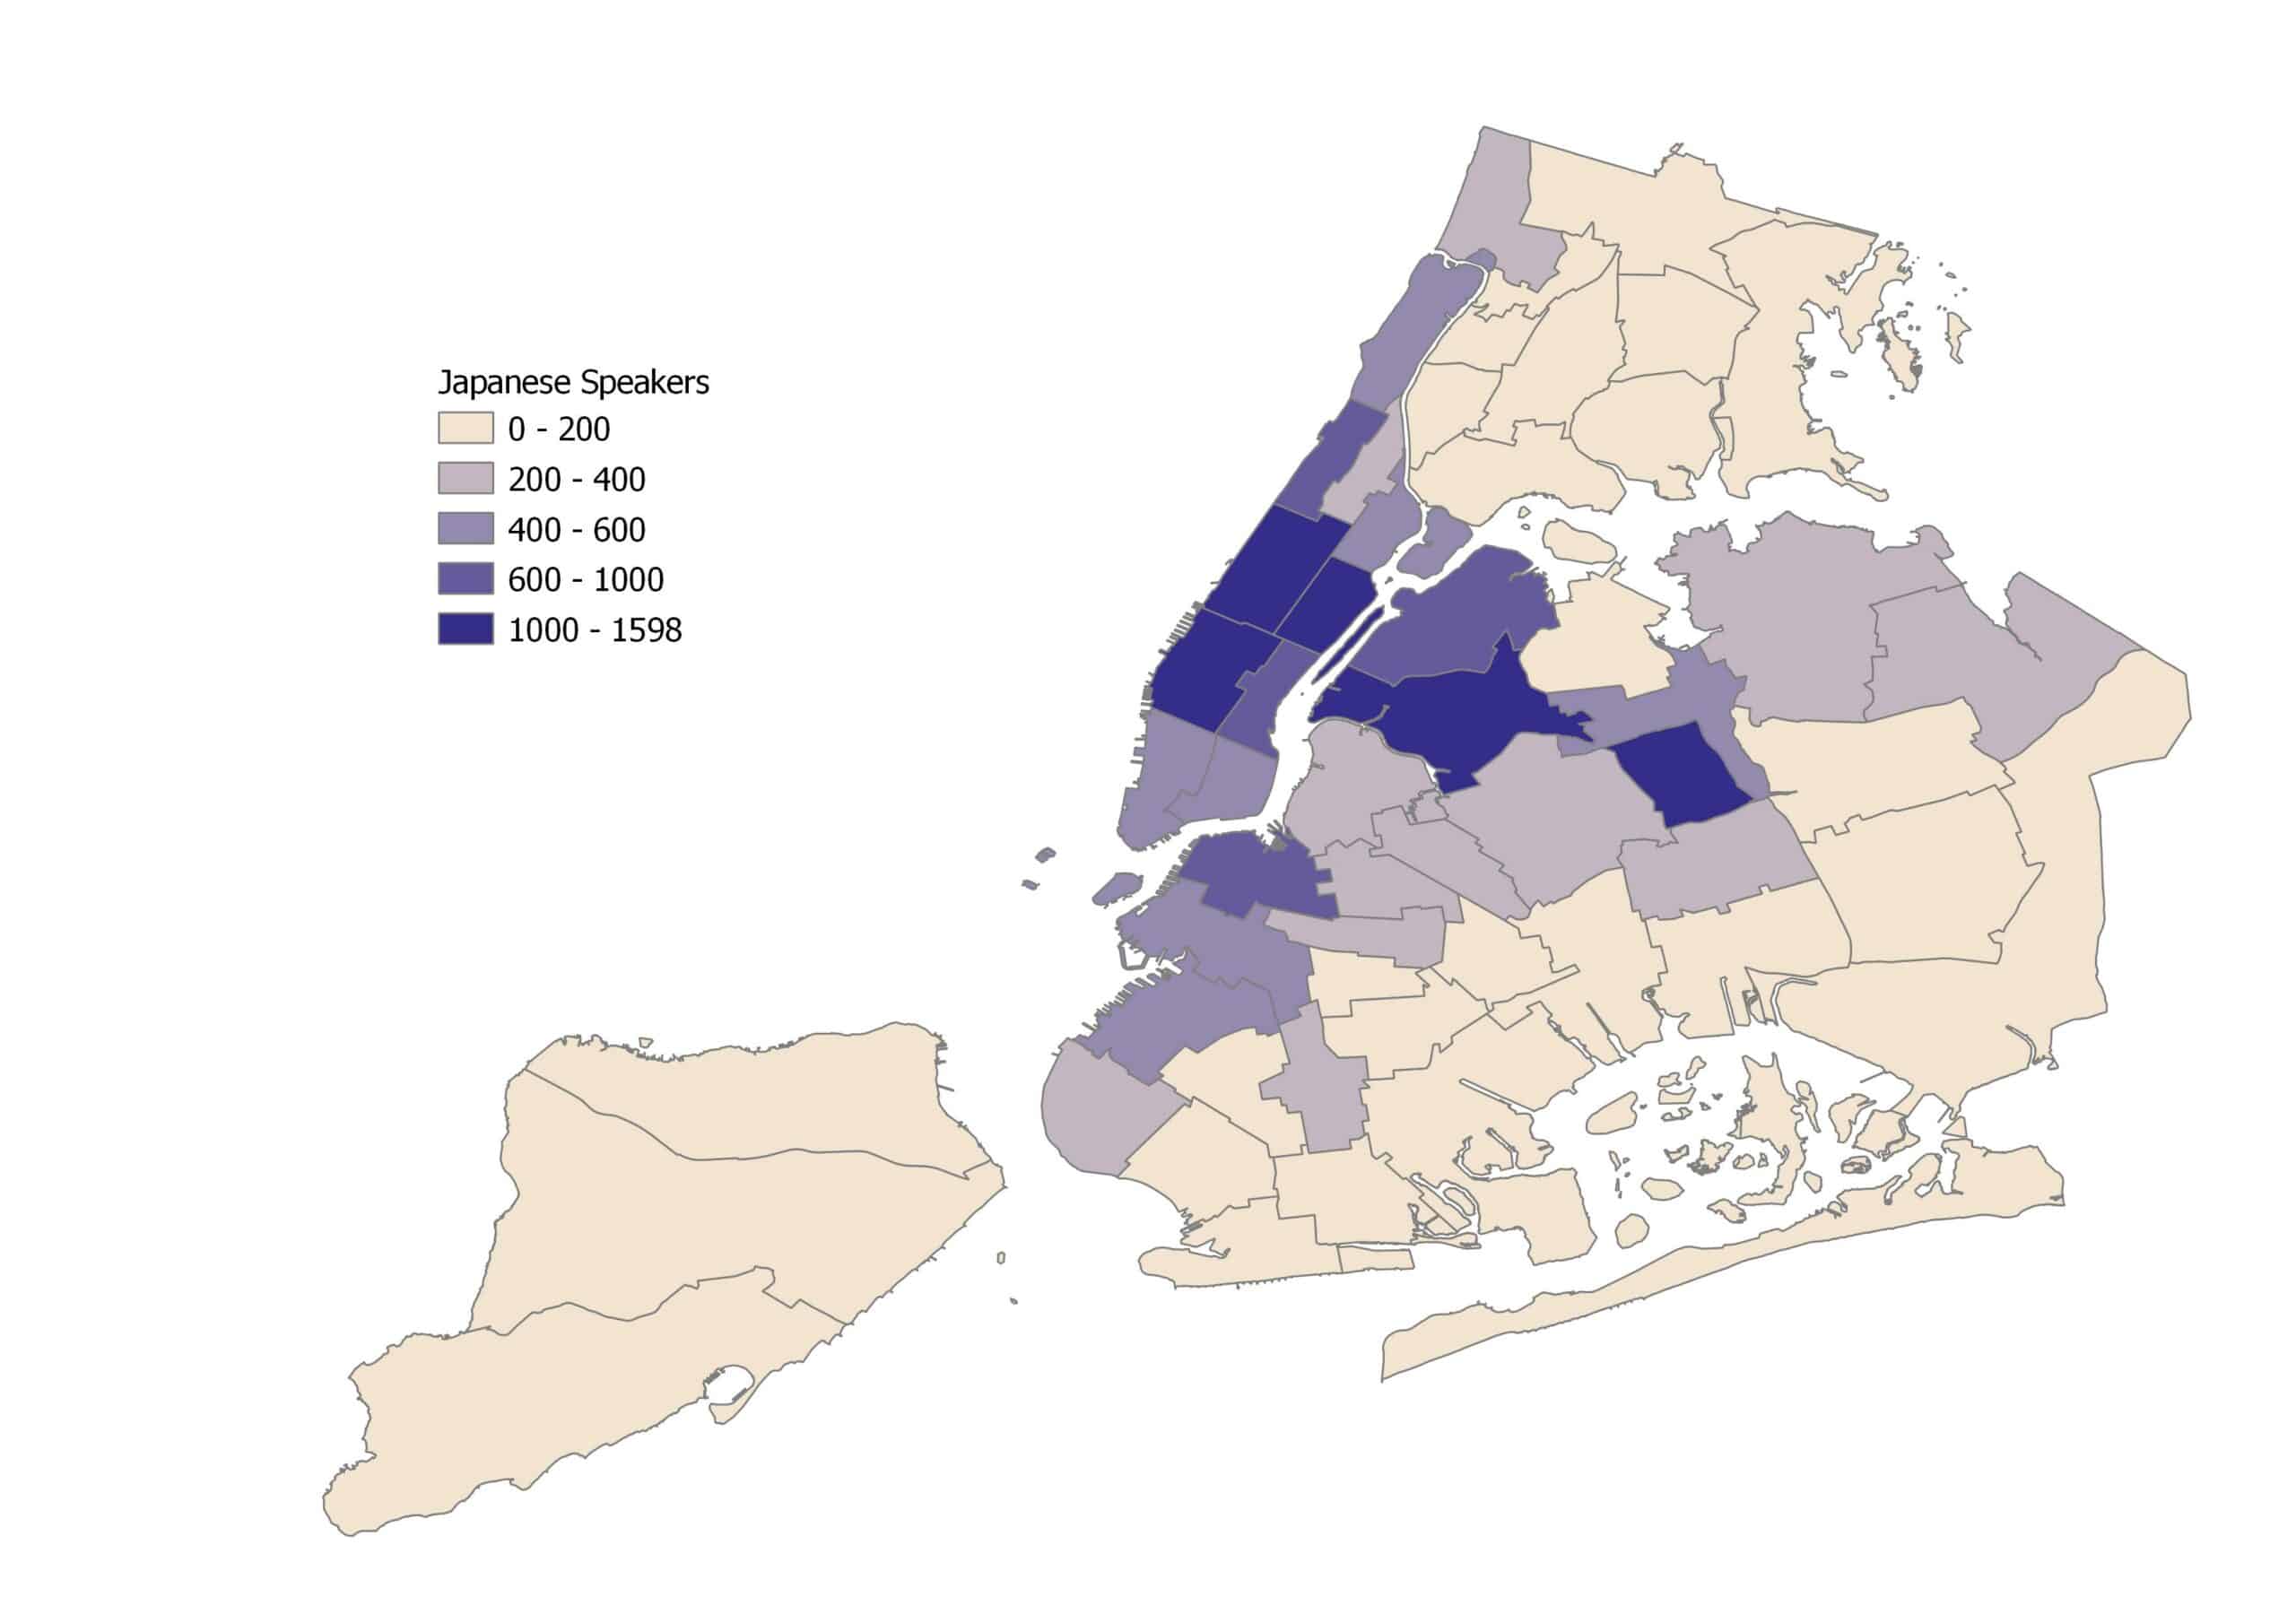
| Japanese | 17,935 | 2.0% |
| Filipino | 15,527 | 1.7% |
| Vietnamese | 9,873 | 1.1% |
Source: American Community Survey 2016-2020 5-year Data by Census Bureau
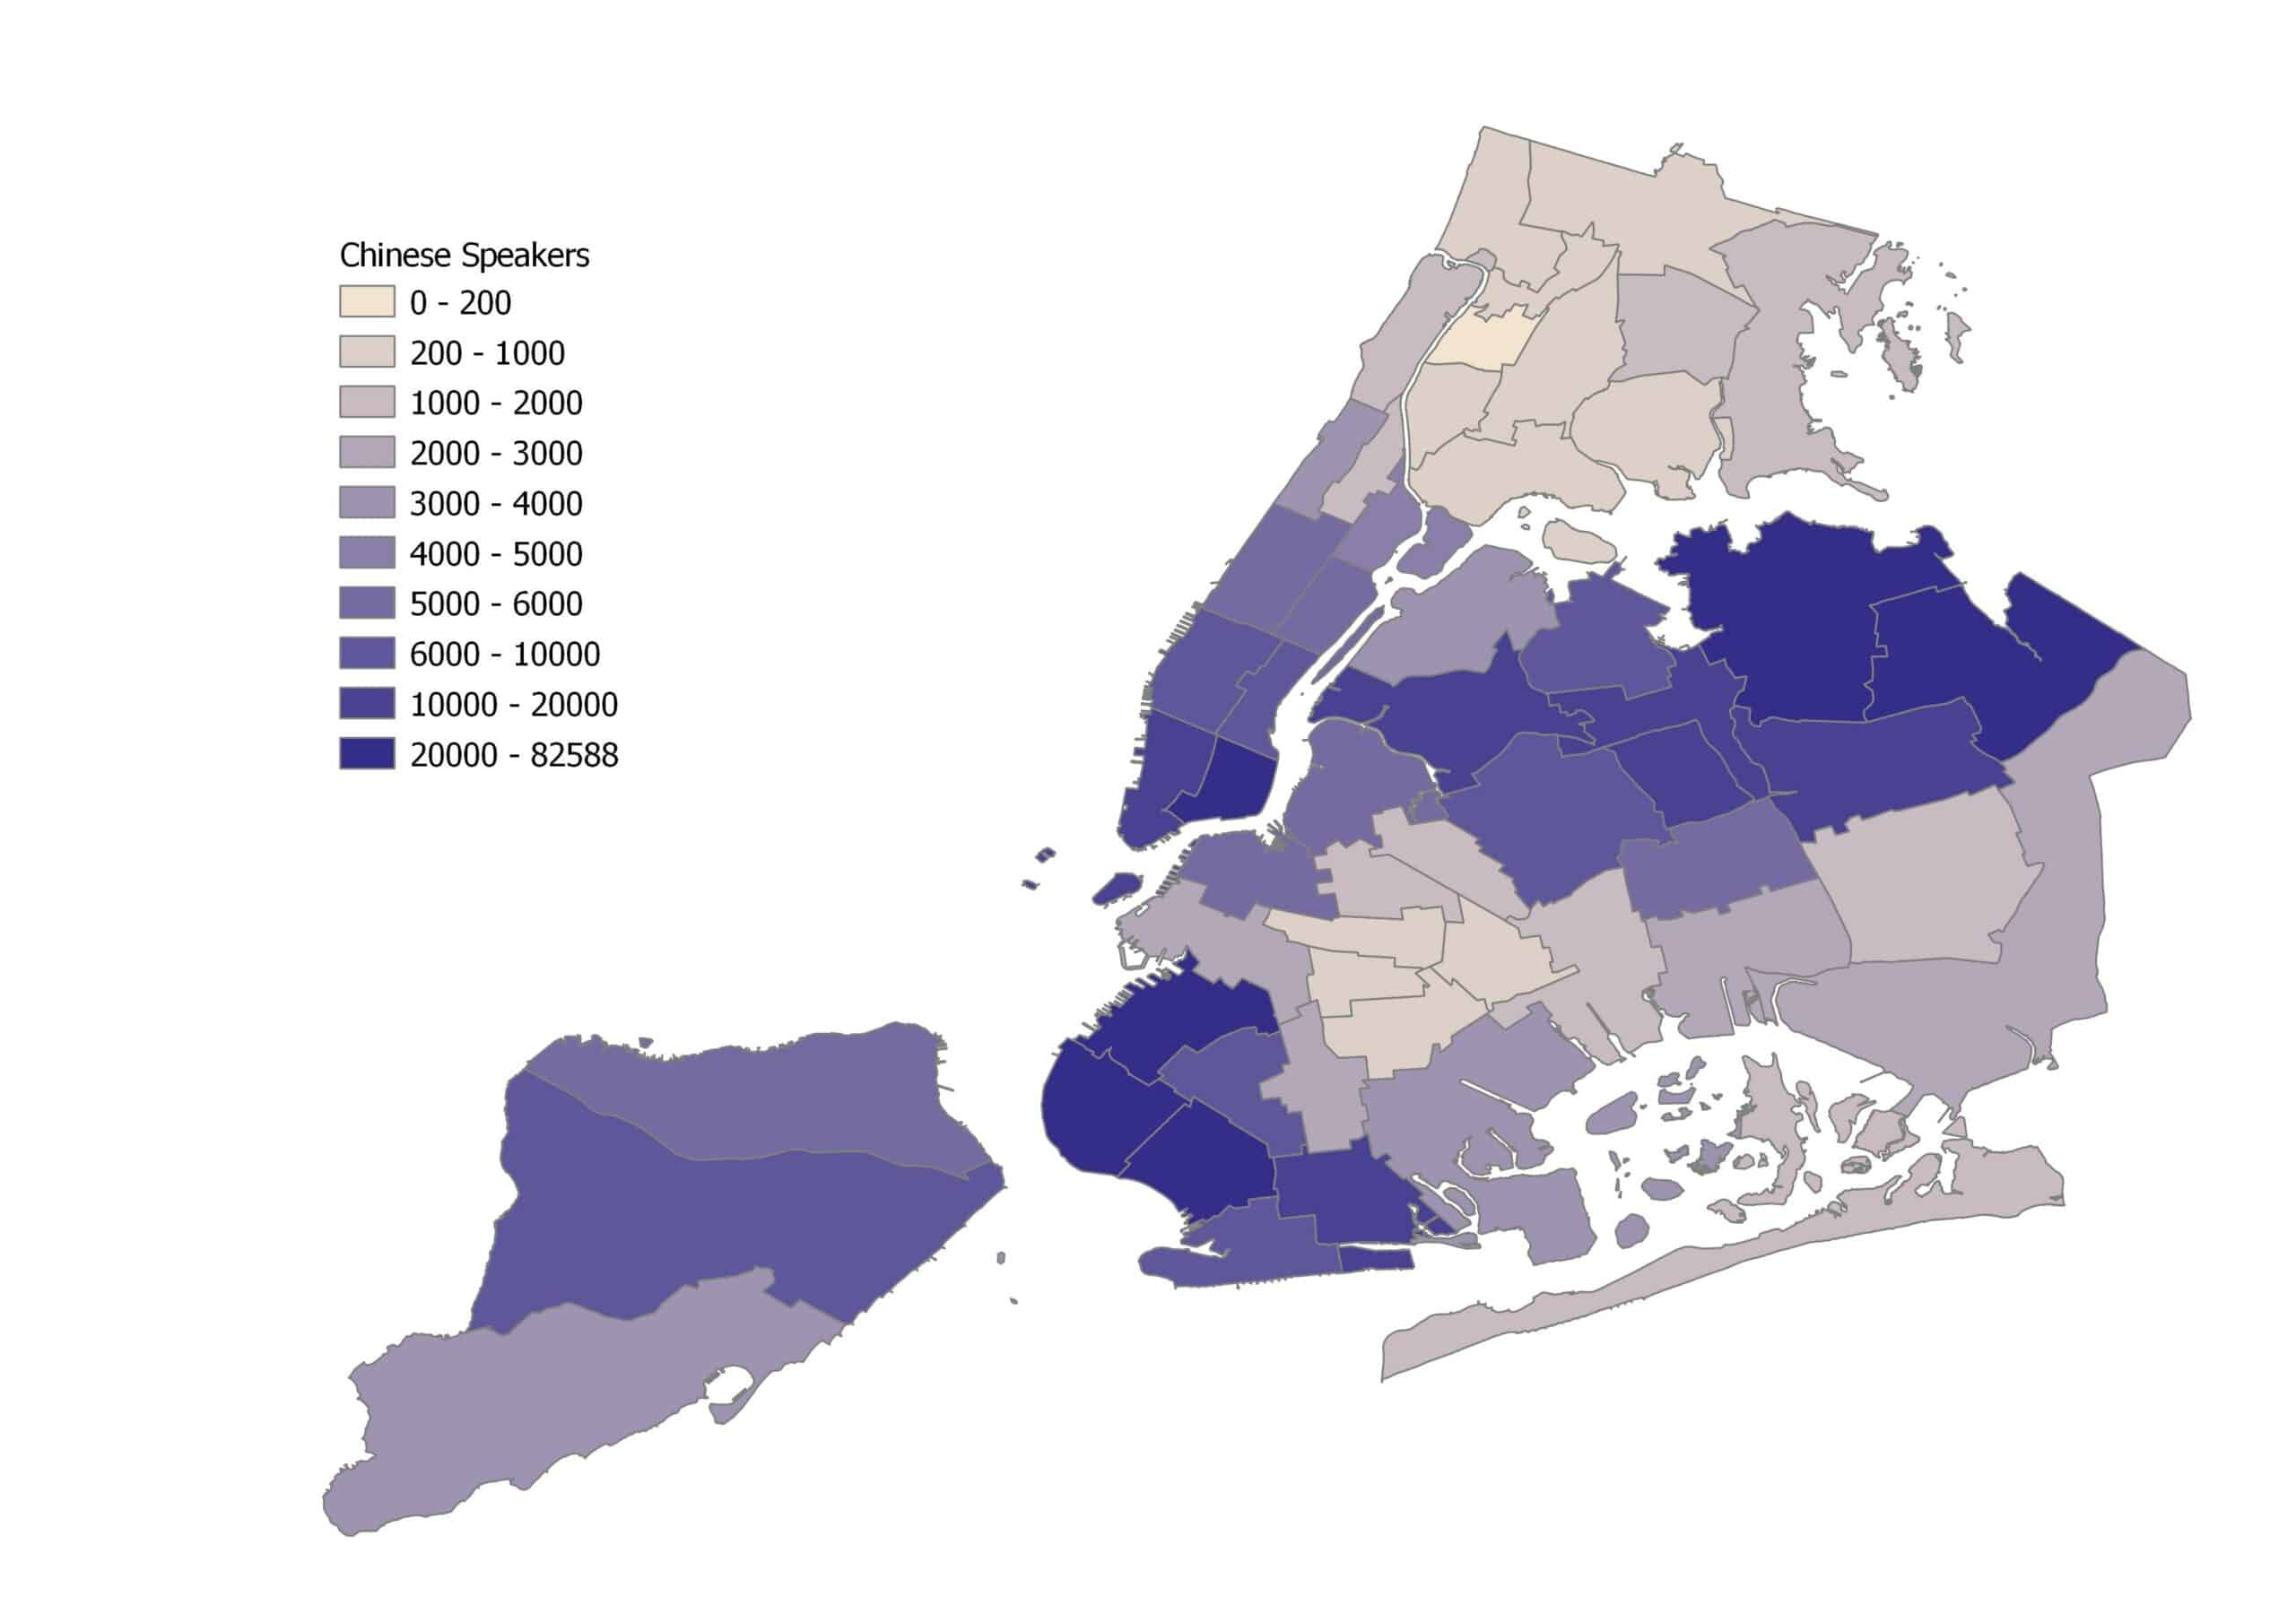
As of 2020, Chinese was the largest (54%) Asian language group in the city.5 However, the high LEP rate of the group, the variety of dialects spoken and the usage of traditional and simplified scripts continued to present challenges when reaching out to the Chinese-speaking population. Queens Community District 7 (Flushing, Murray Hill & Whitestone) had the largest Chinese-speaking population, at 82,588 speakers, followed by Queens Community District 4 (Elmhurst & South Corona), with 55,977 Chinese speakers; Manhattan Community District 3 (Chinatown & Lower East Side), with 37,424 speakers; and Brooklyn Community District 7 (Sunset Park & Windsor Terrace), with 32,922 Chinese speakers.
When combined, the South Asian languages were the second largest (27%) group of Asian languages in the city. The Census Bureau reports a variety of these languages separately, including Bengali, Urdu, Hindi, Punjabi, Nepali, Gujarat, Malayalam, Tamil, Pashto, Sinhala, Telugu, Khmer, Marathi, Kannada, and Konkani.6 The four most populous groups among them, which made up 84% of all the South Asian language speakers in the city, were as follows:
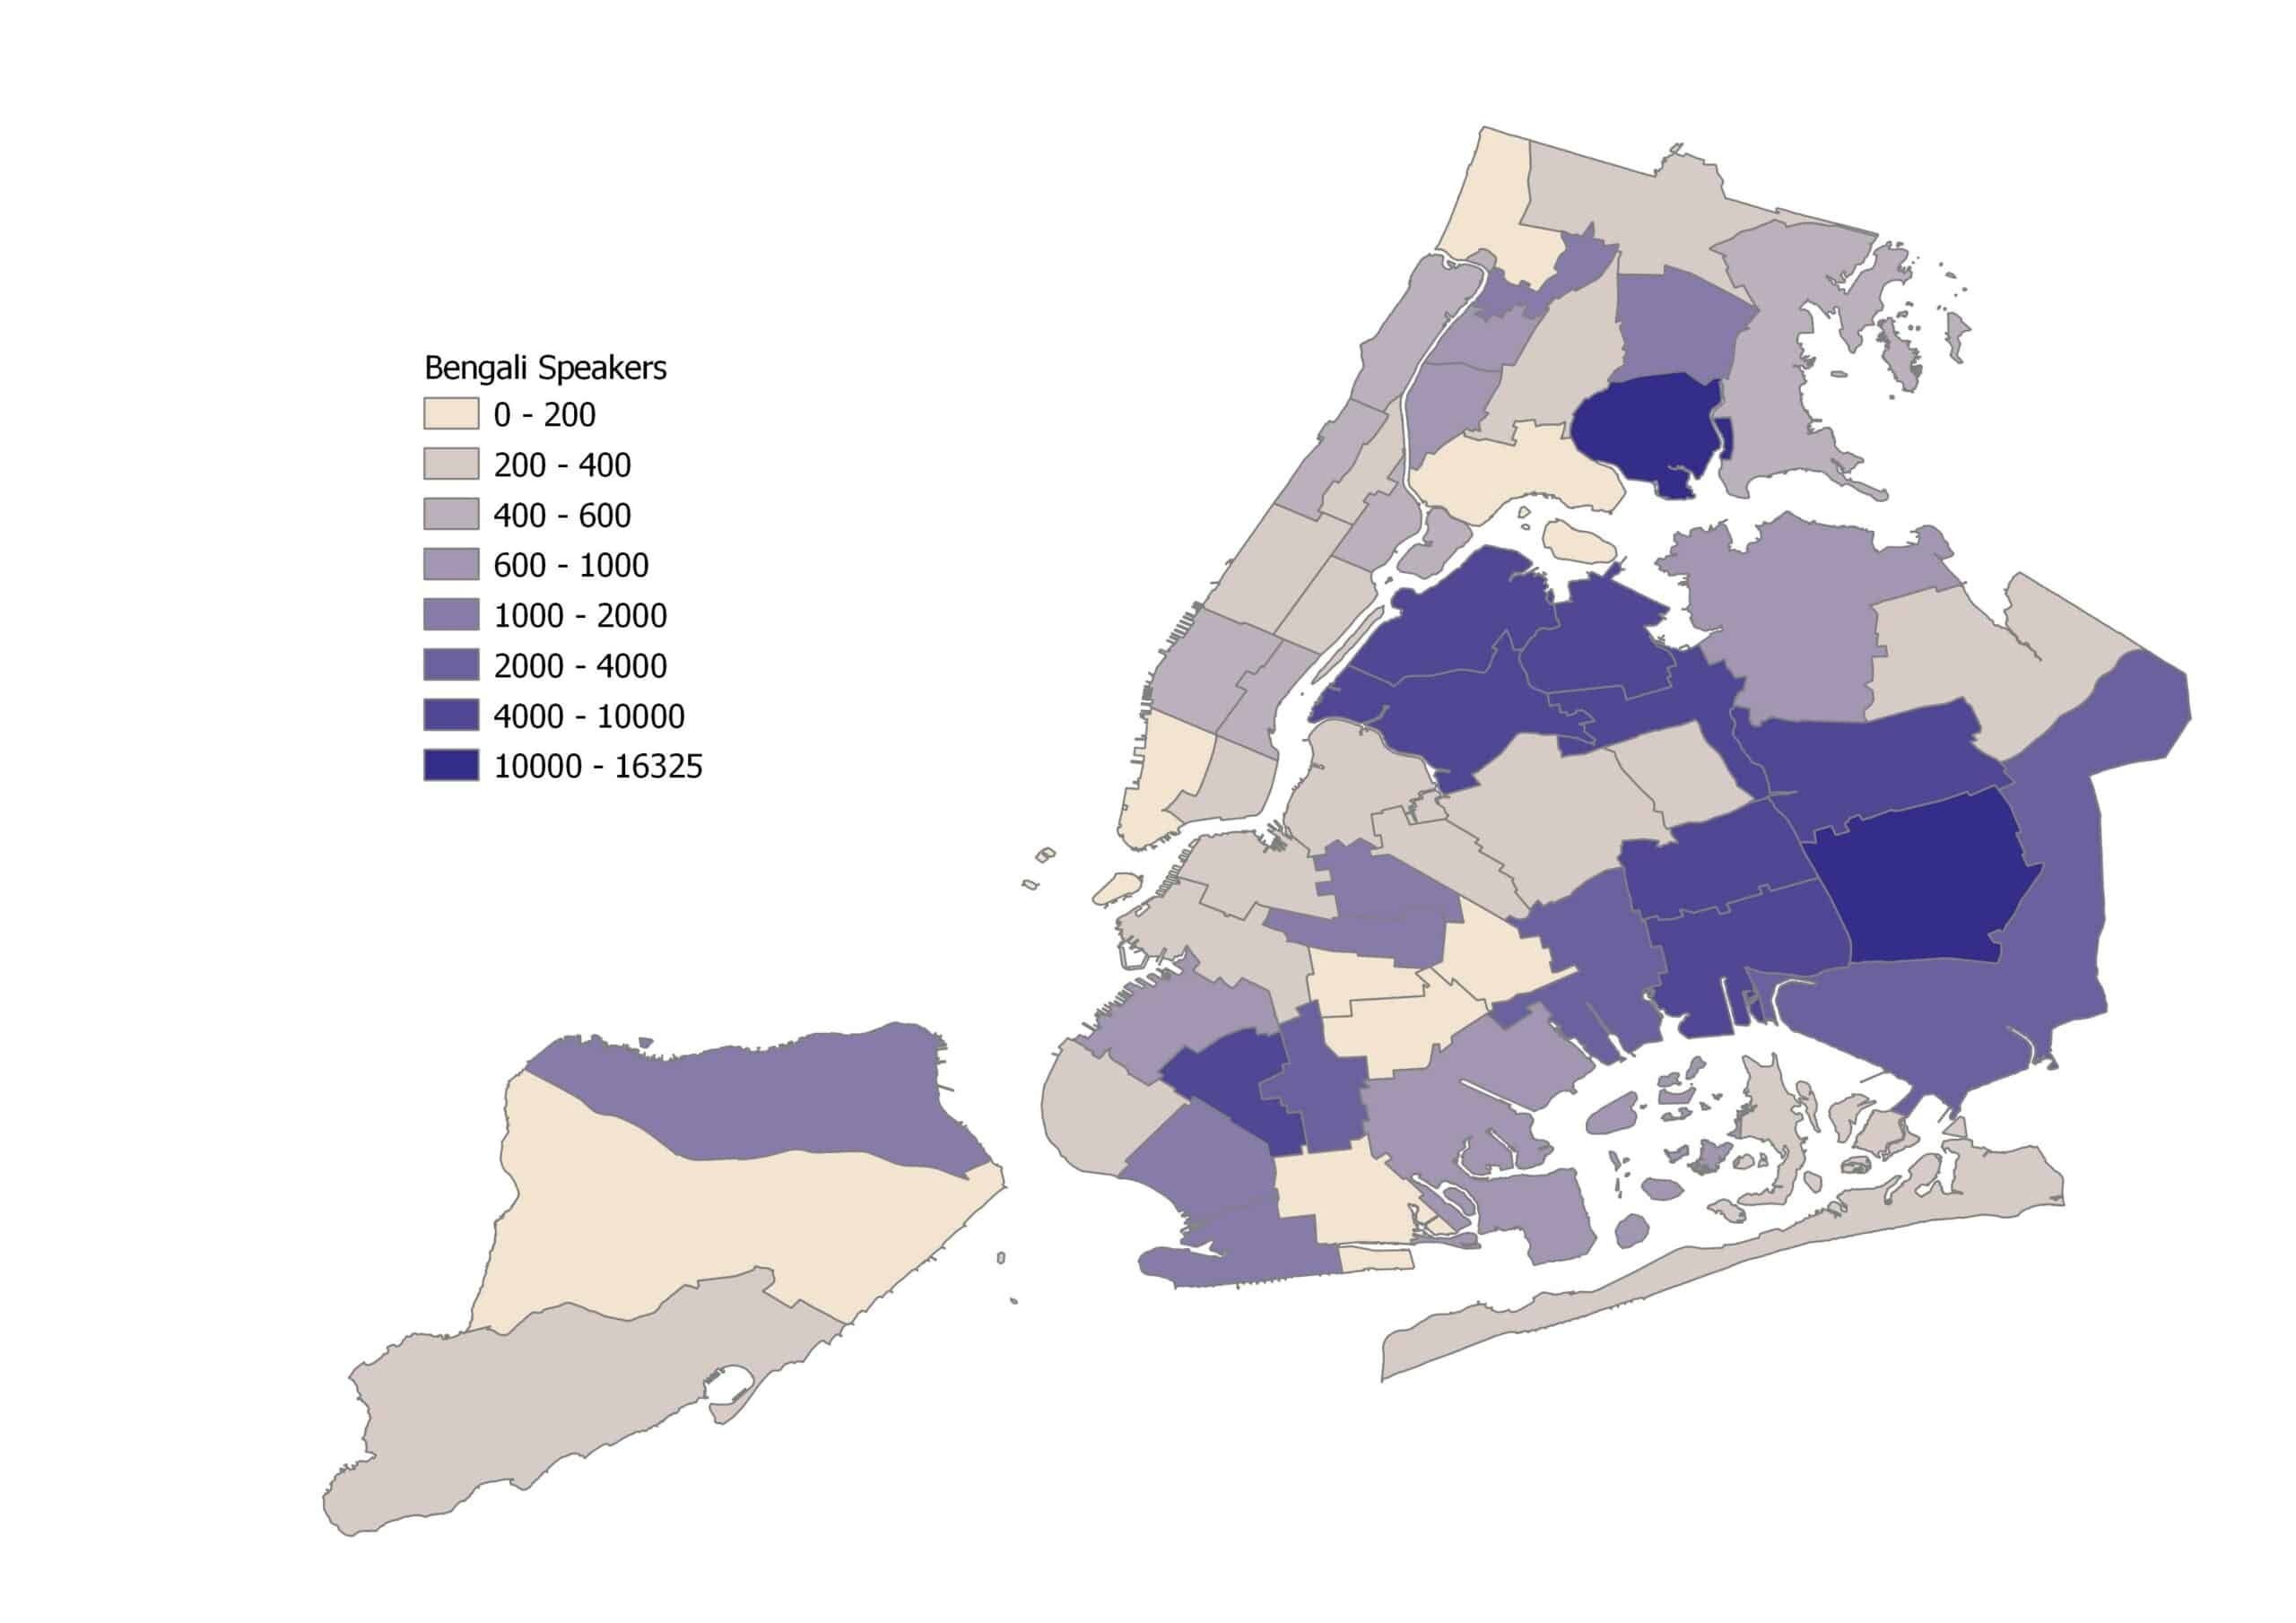
- Bengali was the second most spoken Asian language in New York City. It is widely spoken by immigrants from Bangladesh and India. Queens Community District 12 (Jamaica, Hollis & St. Albans) had the largest Bengali-speaking population, at 16,325; followed by Bronx Community District 9 (Castle Hill, Clason Point & Parkchester) with 10,301 Bengali speakers; and Queens Community District 8 (Briarwood, Fresh Meadows & Hillcrest), at 9,601 Bengali speakers.
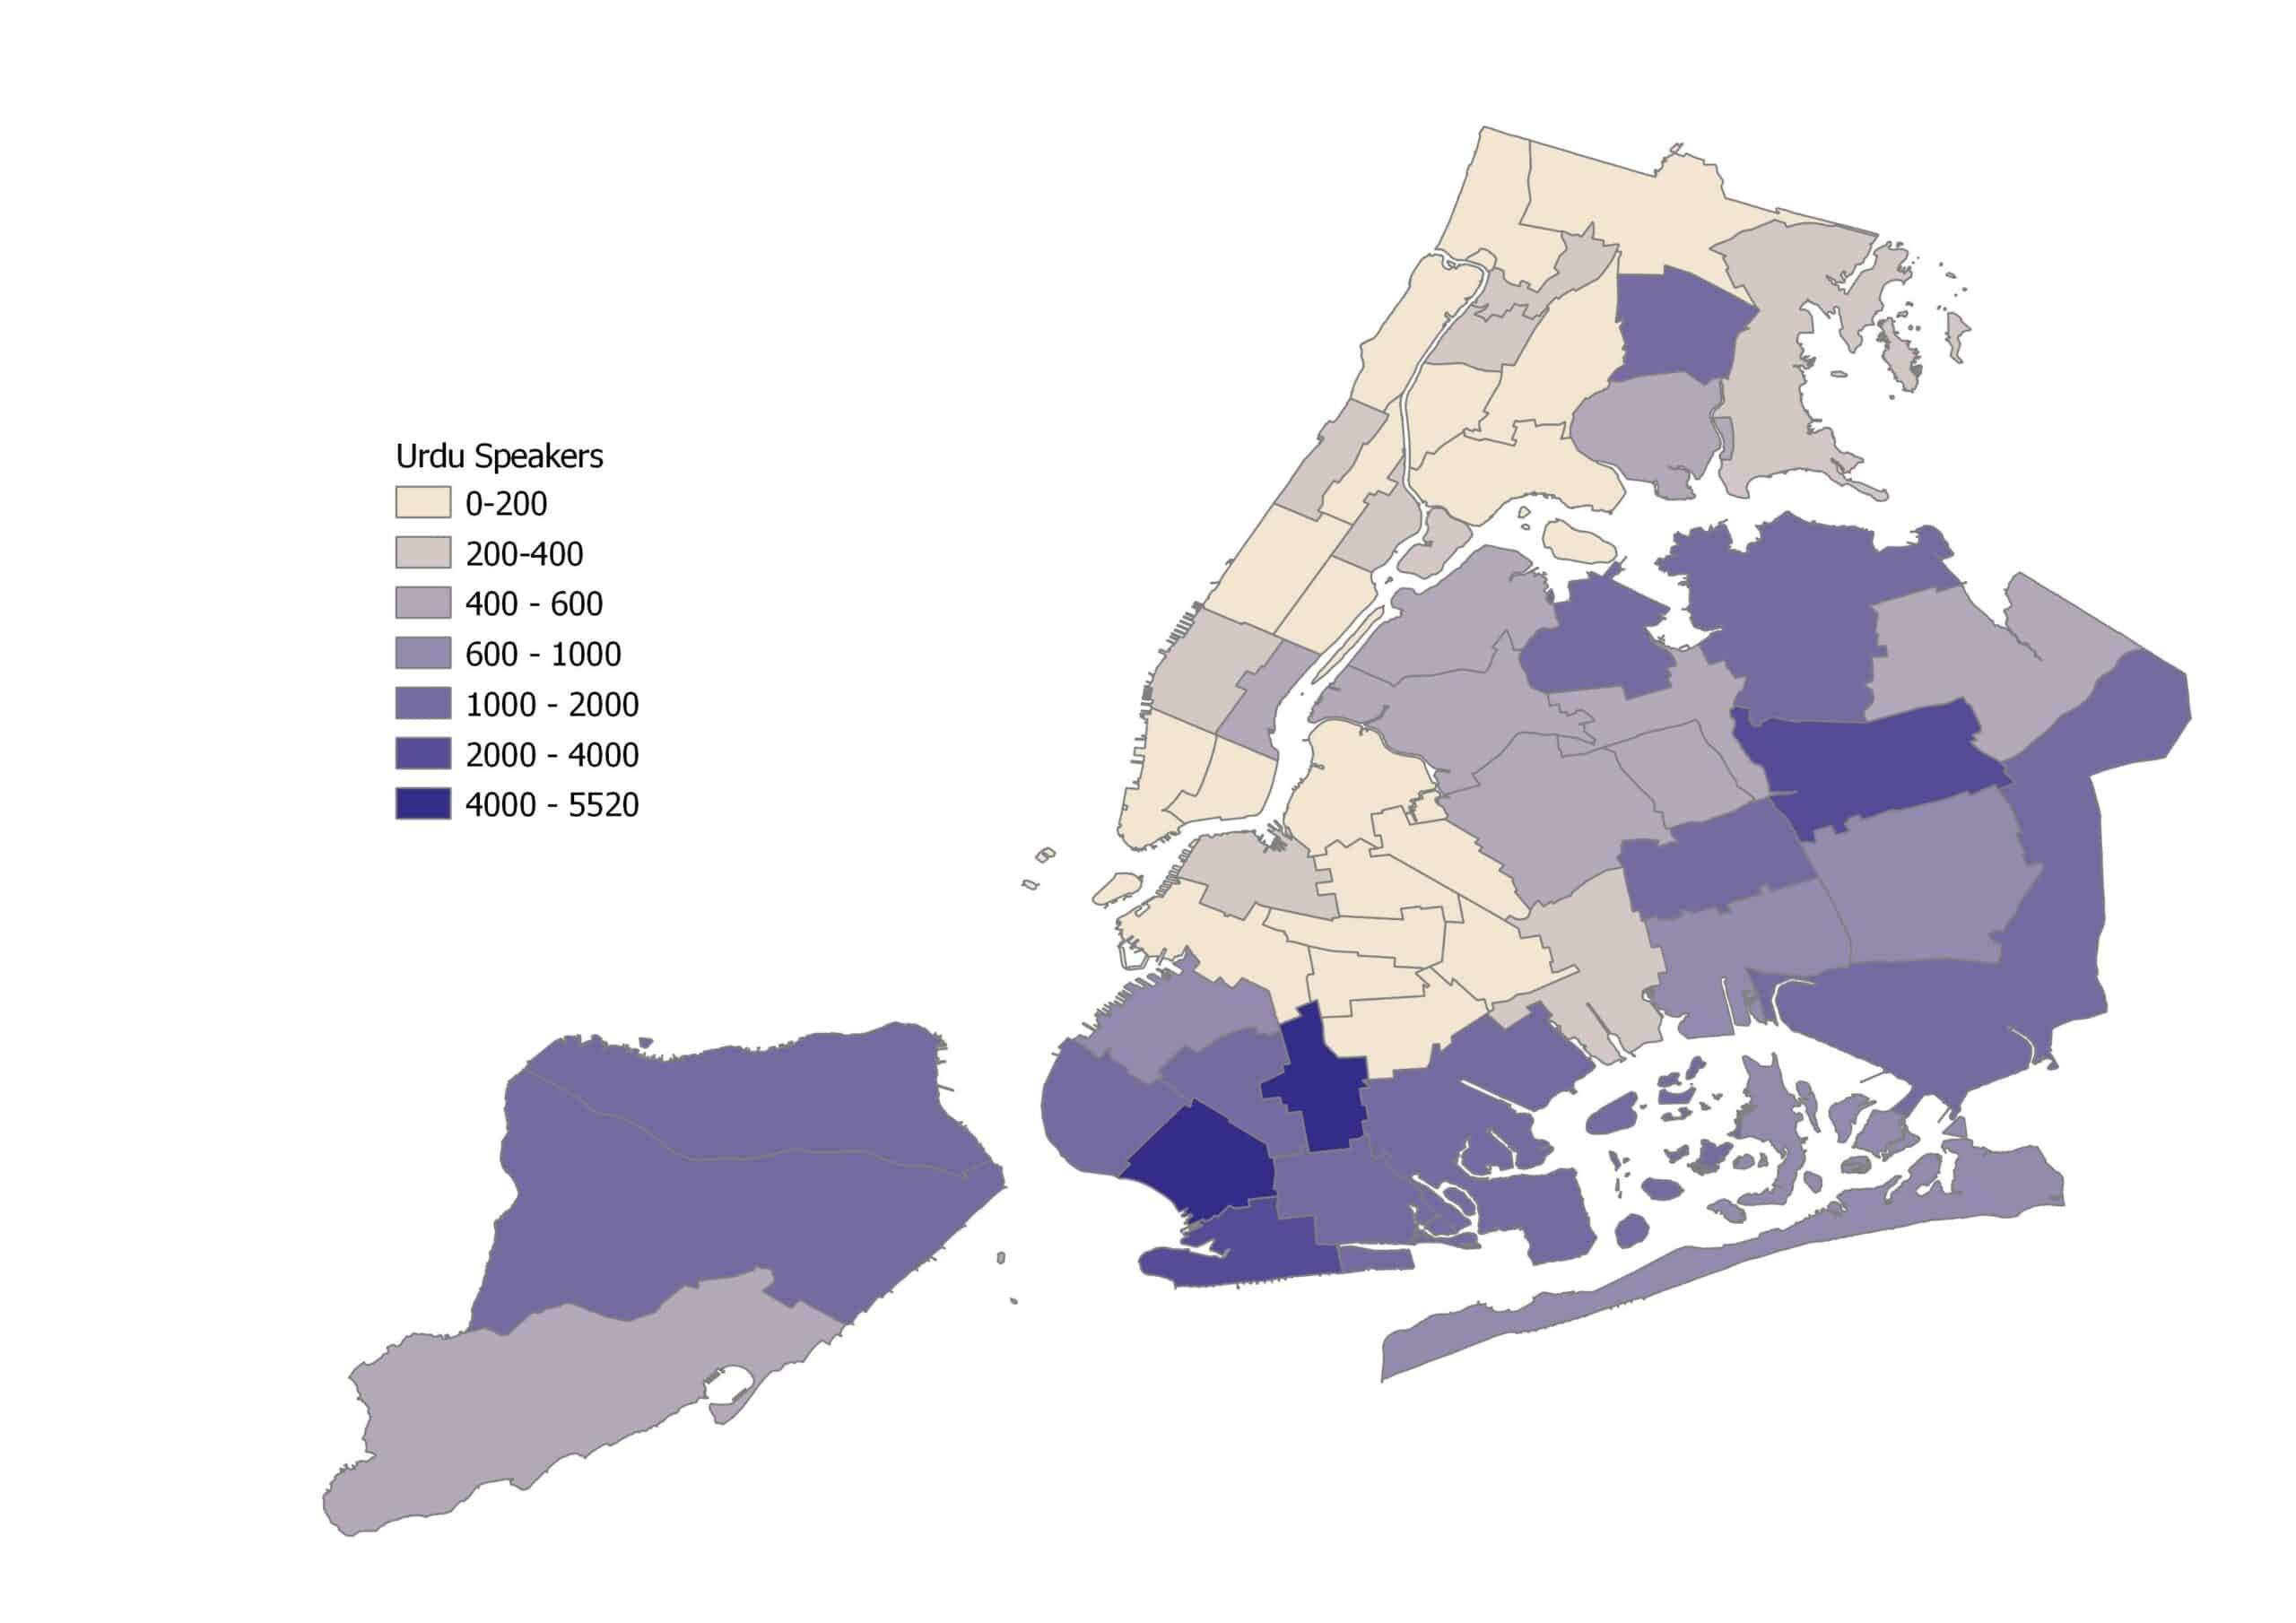
- Urdu, mostly spoken by the Indian population, was the fourth largest language group in the city. Brooklyn Community District 14 (Flatbush & Midwood) had the most Urdu speakers, with 5,520, and Brooklyn Community District 11 (Bensonhurst & Bath Beach) was close behind, with 5,039.
- Hindi, also mostly spoken by Indians in the city, was the sixth largest Asian language group. Queens Community District 6 (Forest Hills & Rego Park) had the most Hindi speakers, with 3,278; followed by Queens Community District 13 (Queens Village, Cambria Heights & Rosedale), with 2,260; and Manhattan Community District 8 (Upper East), with 2,239.
- Punjabi, mostly spoken by Indians and Pakistanis, was the seventh largest Asian language group. Queens Community District 9 (Richmond HIll & Woodhaven) had the largest Punjabi-speaking population, at 6,727; followed by Queens Community District 13 (Queens Village, Cambria Heights & Rosedale) at 4,801; and Queens Community District 10 (Howard Beach & Ozone Park) at 3,888.
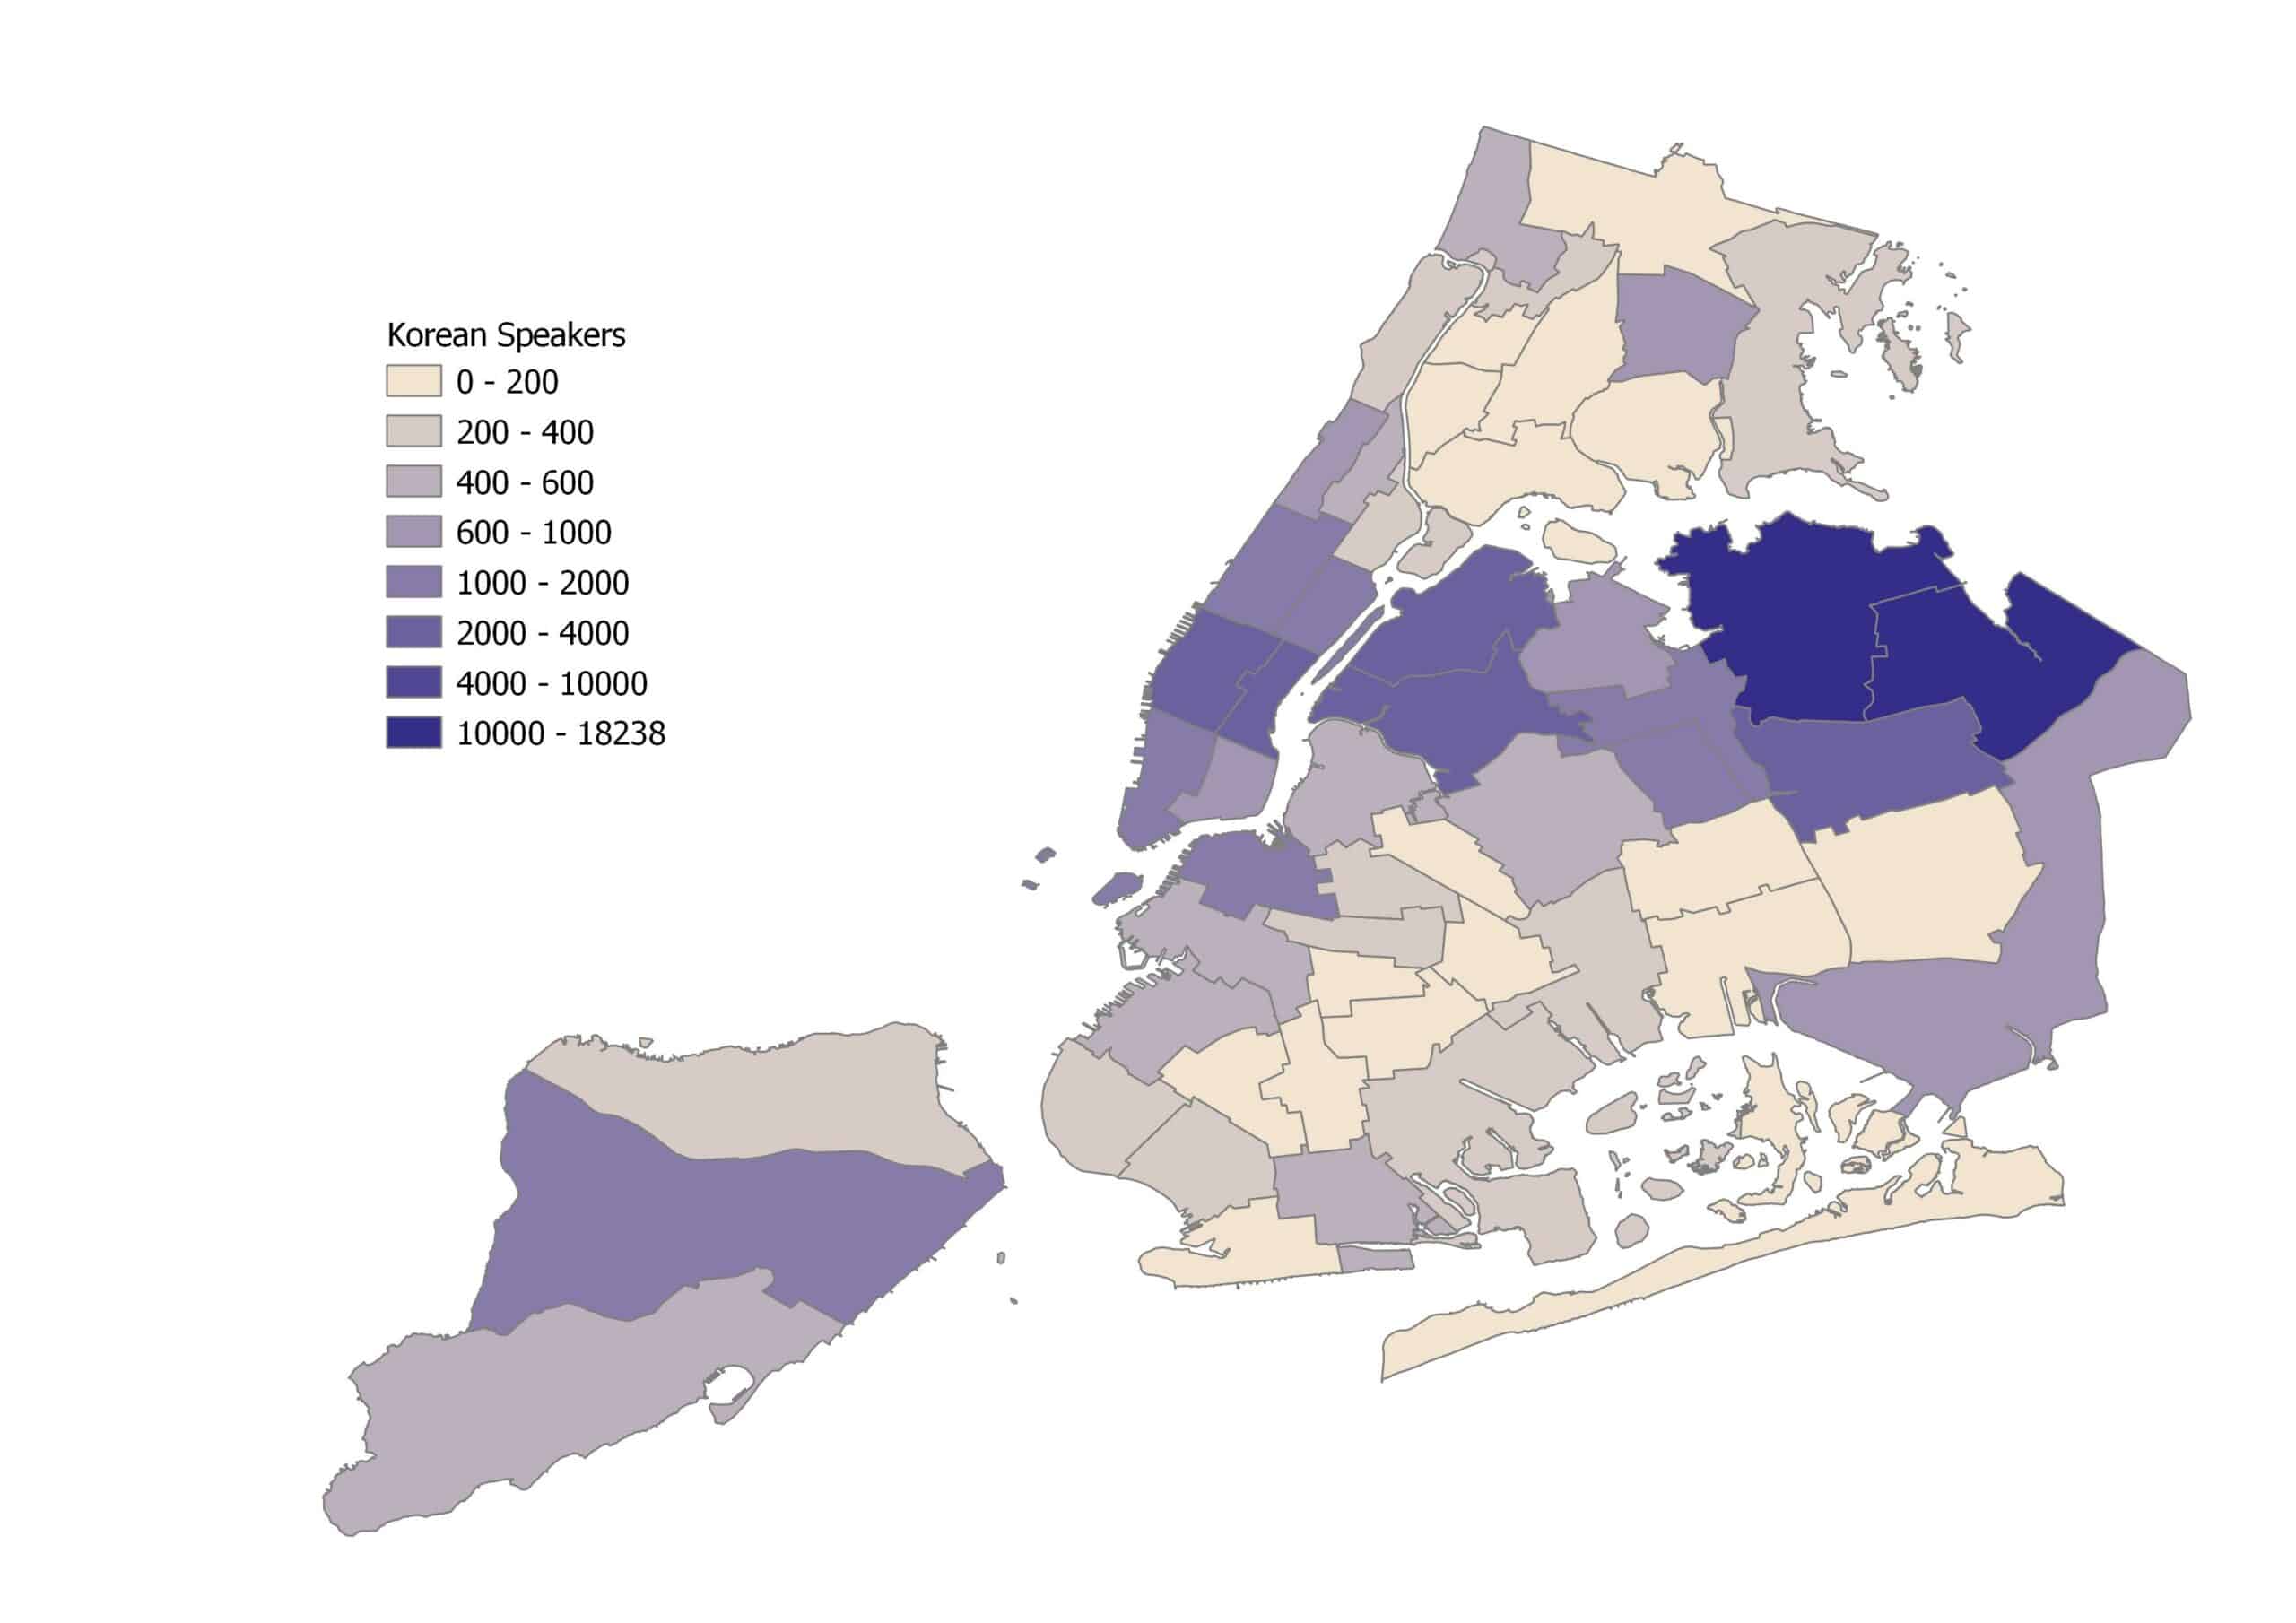
Korean was the third most common Asian language in the city. Queens Community District 7 (Flushing, Murray Hill & Whitestone) had the largest number of Korean speakers, at 18,238; followed by Queens Community District 11 (Bayside, Douglaston & Little Neck), with 11,290 speakers, and Manhattan Community District 6 (Murray Hill, Gramercy & Stuyvesant Town), with 3,019 speakers.
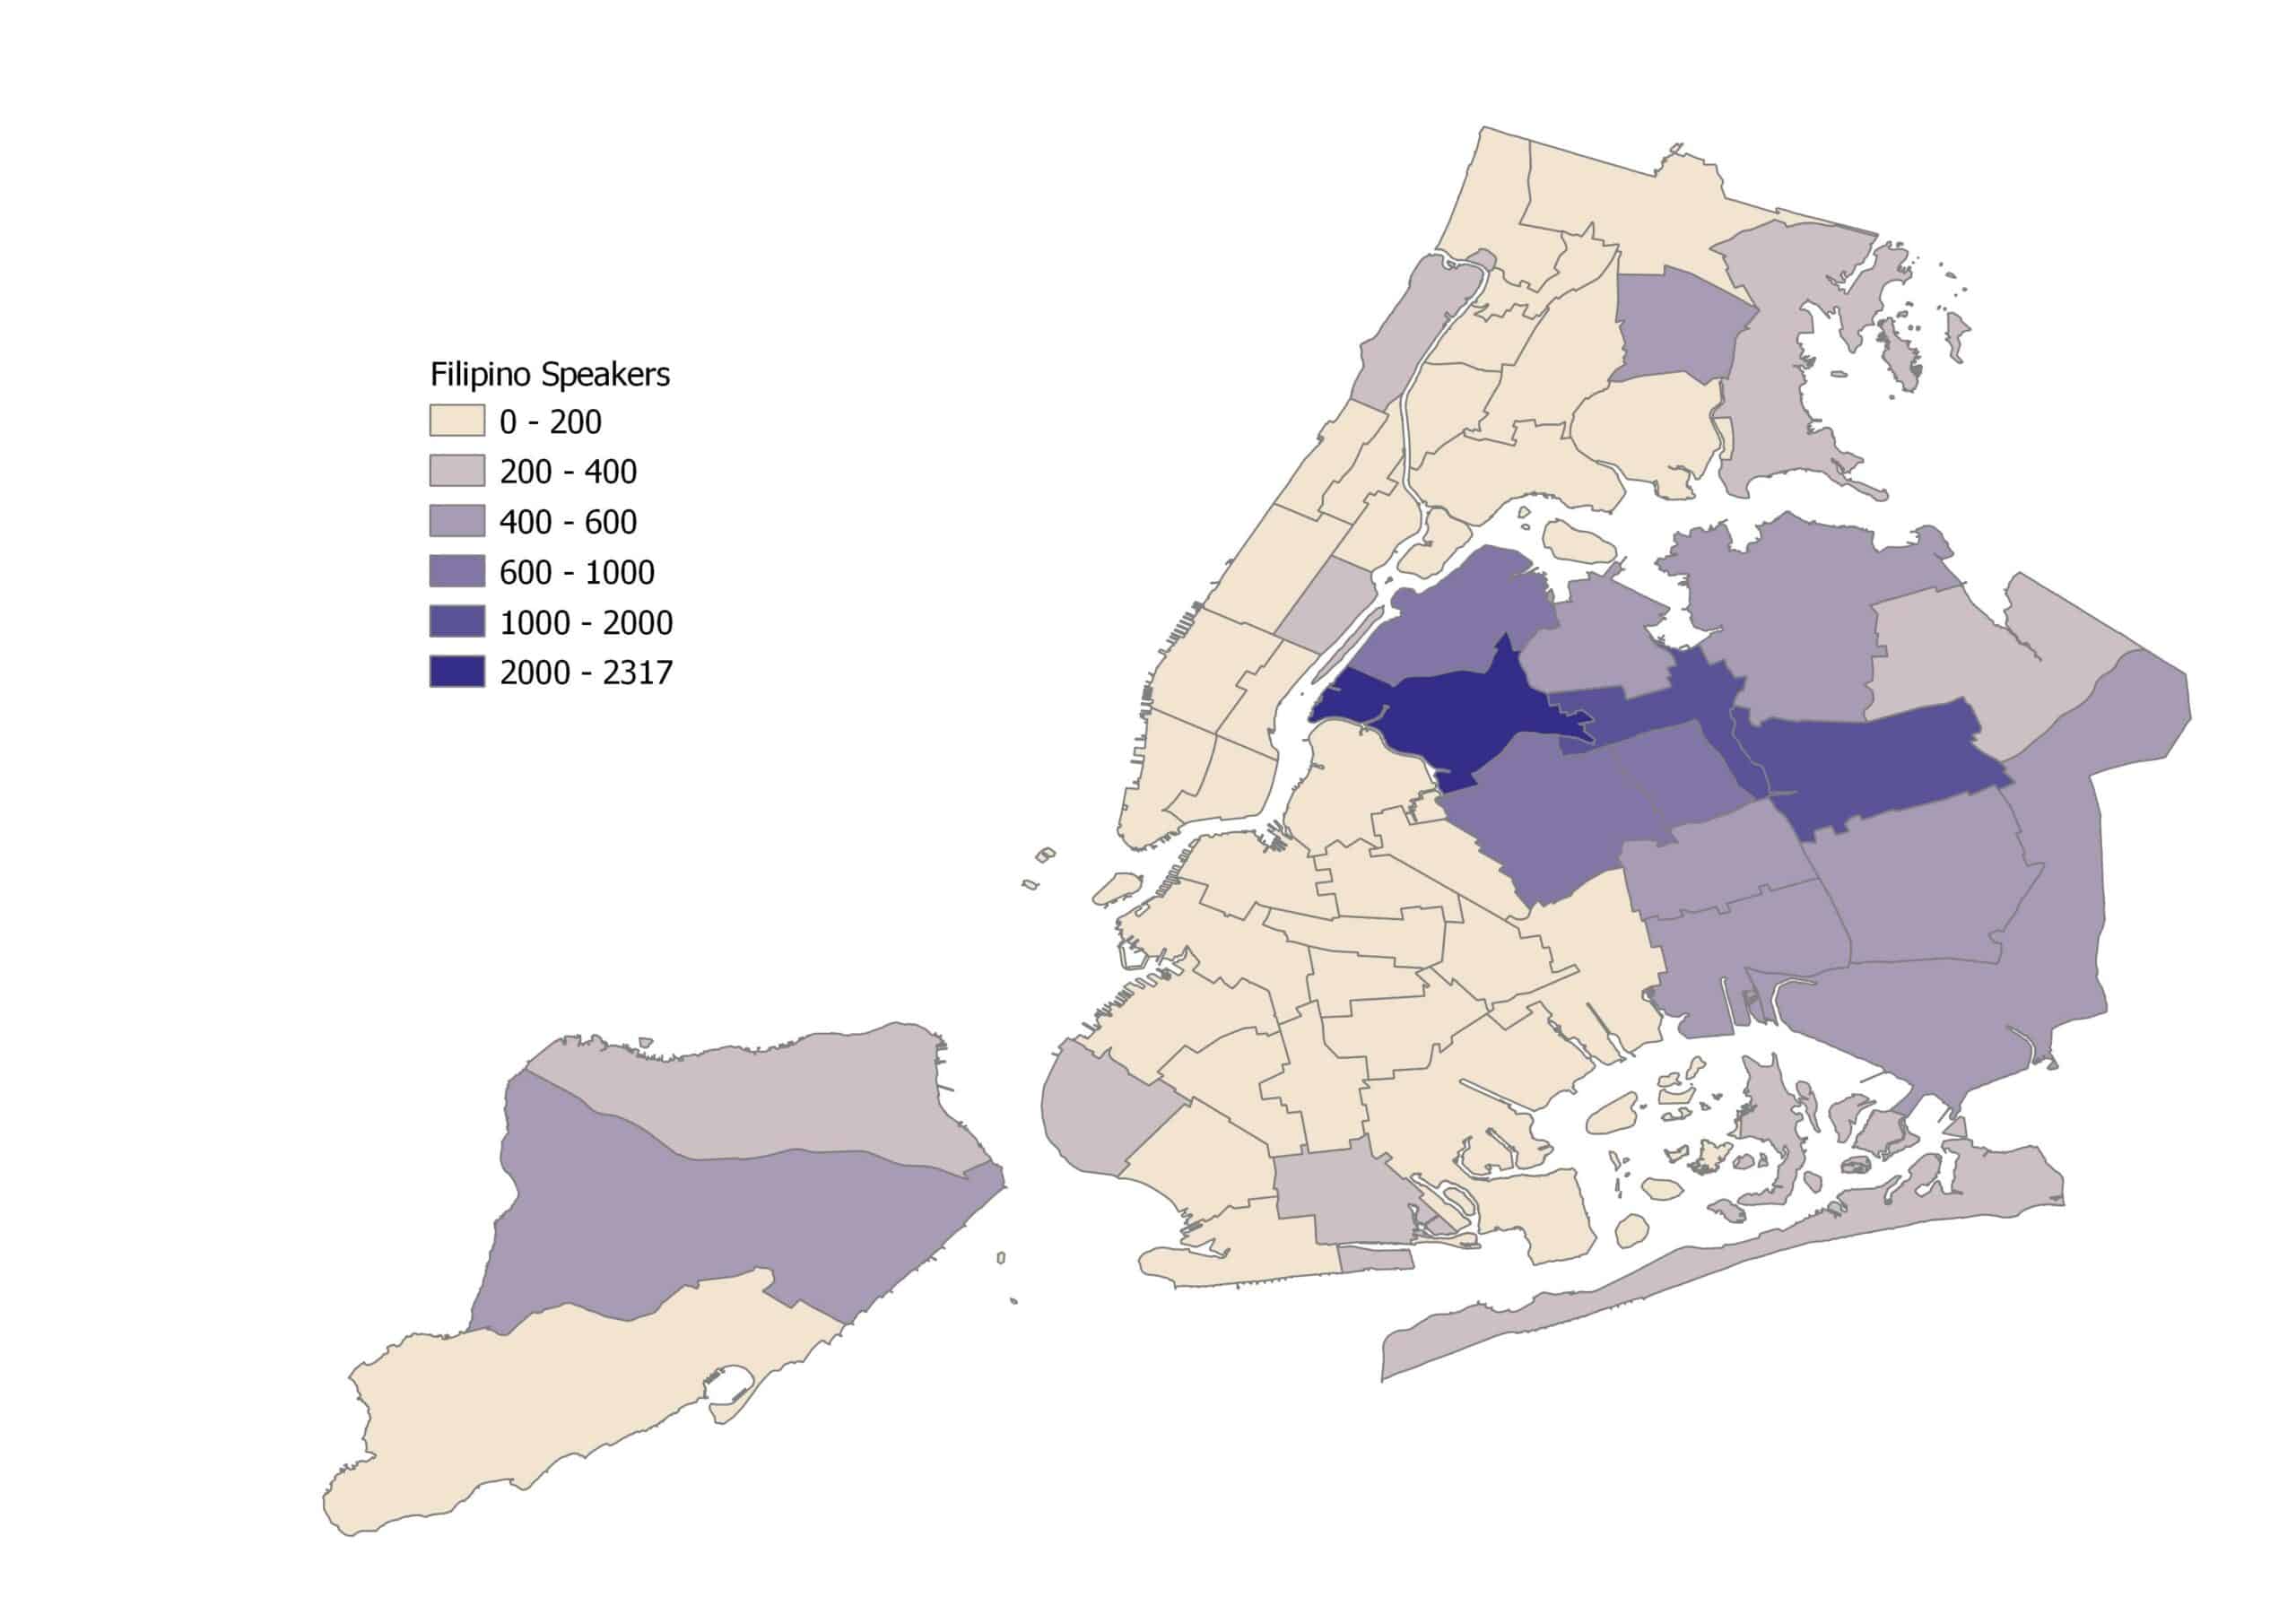
Tagalog, widely spoken by Filipinos, was the fifth largest Asian language group in New York City. Queens Community District 4 (Elmhurst & South Corona) had the largest Tagalog-speaking population, at 4,110; followed by Queens Community District 2 (Sunnyside & Woodside) at 3,351; Queens Community District 8 (Briarwood, Fresh Meadows & Hillcrest), at 3,130; and Queens Community District 13 (Queens Village, Cambria Heights & Rosedale), at 2,232.
Filipino, a standardized variety of Tagalog, was the ninth largest Asian language group in New York City. The geographic coverage of Filipino speakers largely overlapped with that of the Tagalog speakers. Queens Community District 2 had the largest Filipino-speaking population, at 2,317; followed by Queens Community District 8, at 1,082; and Queens Community District 4, at 1,004.
Japanese was the eighth largest Asian language group in the city. Japanese-speaking residents were spread across lower Manhattan fairly evenly, with between 1,100 to 1,800 speakers residing in Manhattan Community Districts 4 through 8. Additional pockets of Japanese speakers are found in Queens in Districts 2 (Sunnyside & Woodside), and 6 (Forest Hills & Rego Park).
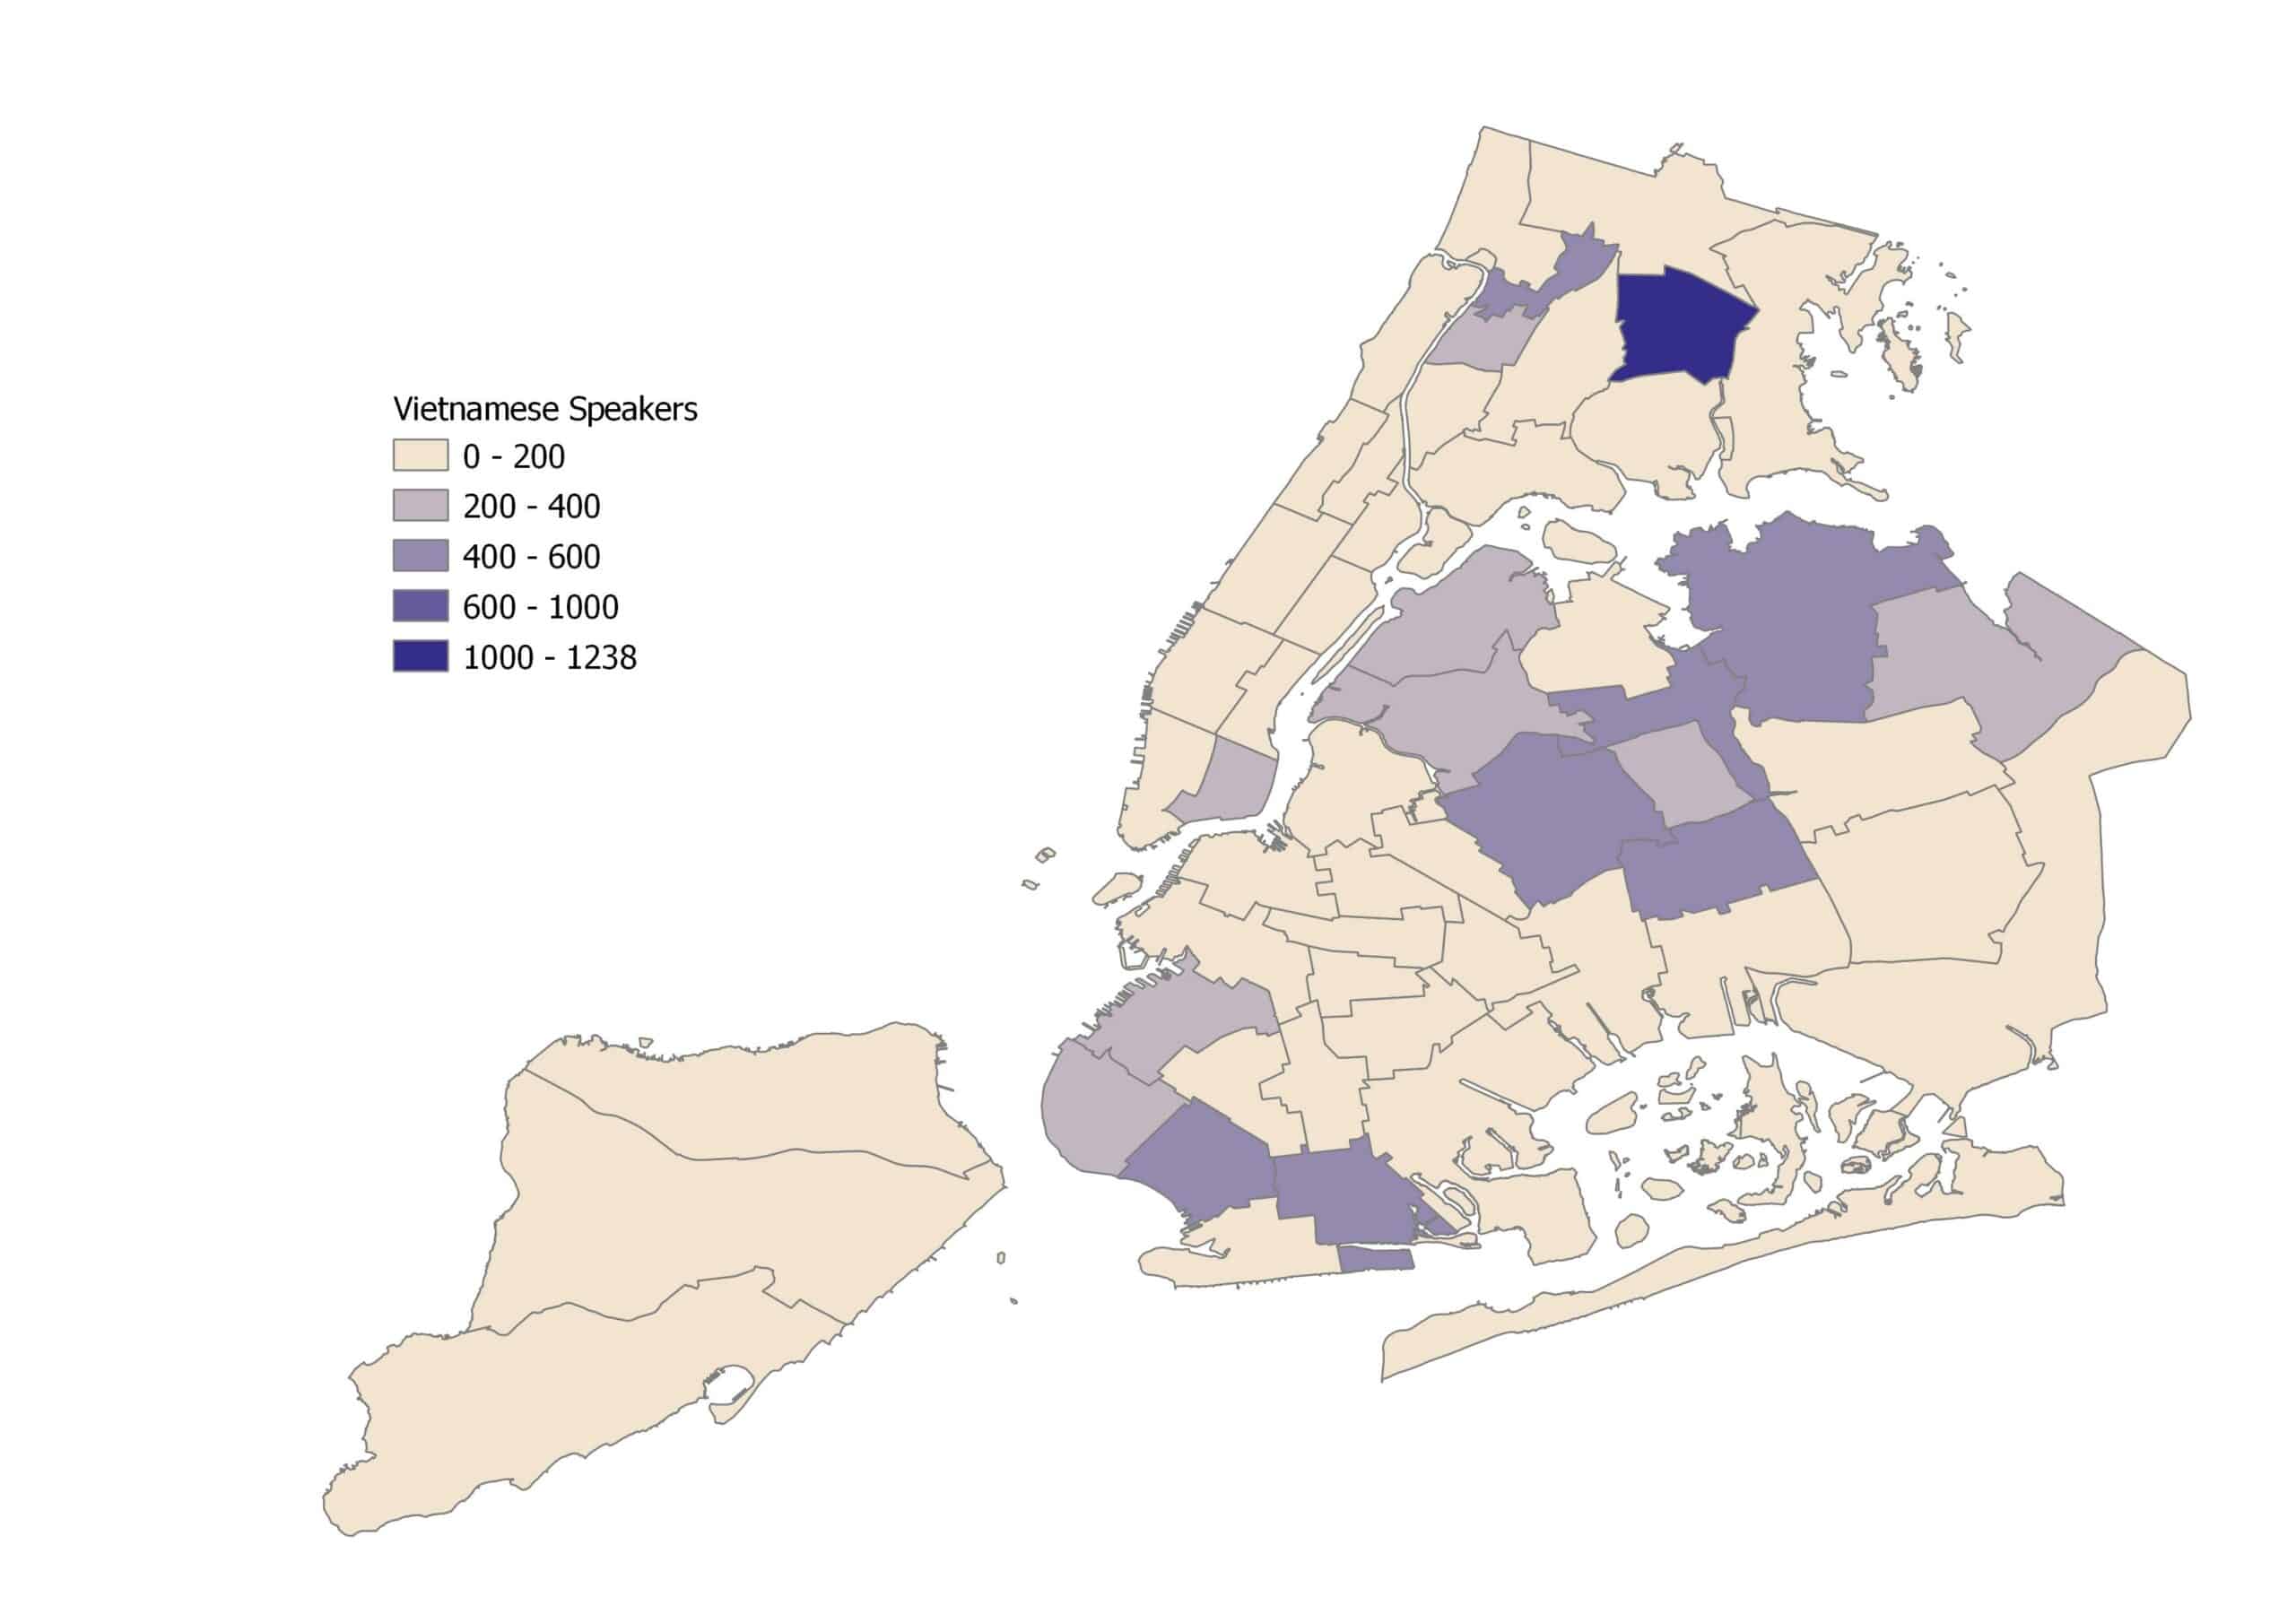
Vietnamese was the tenth largest Asian language group in the city. Bronx Community District 11 (Pelham Parkway, Morris Park & Laconia) had the most Vietnamese speakers, with 1,238 residents.
Besides these top 10 Asian languages spoken citywide, Nepali, Gujarati, Malayalam, Tibetan, Thai, and Burmese also had more than 5,000 speakers in New York City. And the population that spoke other Asian languages in 2020 is reported in Table 2.
Table 2: Population of Asian languages Speakers, NYC, 2020
| Asian Language Group | Citywide Speakers |
| Nepali | 9,124 |
| Gujarati | 8,405 |
| Malayalam | 7,380 |
| Tibetan | 7,155 |
| Thai | 6,129 |
| Burmese | 5,302 |
| Tamil | 4,434 |
| Indonesian | 3,179 |
| Pashto | 2,900 |
| Sinhala | 2,484 |
| Telugu | 2,336 |
| Khmer | 2,074 |
| Pakistan N.E.C.* | 1,546 |
| Cebuano | 1,528 |
| India N.E.C.* | 1,204 |
| Marathi | 1,151 |
| Malay | 616 |
| IIacano | 597 |
| Kannada | 481 |
| Lao | 250 |
| Konkani | 182 |
| Mongolian | 152 |
| Chin Languages | 112 |
| Hmong | 65 |
Source: American Community Survey 2016-2020 5-year Data by Census Bureau
While for the majority of the Community Districts, their three most populous Asian language groups fell within the top 10 Asian languages spoken citywide (as shown in Appendix), there were a few exceptions:
- The most populous Asian language group in Bronx Community District 12 (Wakefield, Williamsbridge & Woodlawn) was Khmer, with 581 speakers.
- The third populous Asian language group in Bronx Community District 4 (Concourse, Highbridge & Mount Eden) was Thai, with 158 speakers.
- The third most populous Asian language group in Staten Island Community District 2 (New Springville & South Beach) was Malayalam, with 1,346 speakers.
- The second most populous Asian language group in Brooklyn Community District 1 (Greenpoint & Williamsburg) was Tibetan, with 554 speakers.
- The third most common Asian language in Brooklyn Community District 16 (Brownsville & Ocean Hill) was Burmese with 97 speakers.
- The third most common Asian language in Queens Community District 3 (Jackson Heights & North Corona ) was Tibetan with 1,343 speakers.
- The third most populous Asian language group in Queens Community District 11 (Bayside, Douglaston & Little Neck) was Pashto, with 758 speakers.
- The third most populous Asian language group in Queens Community District 5 (Ridgewood, Glendale & Middle Village) was Nepali, with 606 speakers.
Appendix
Representation of City’s Top 10 Asian Language Groups by Community District, NYC, 2020