Chinese in NYC: A Profile
Population
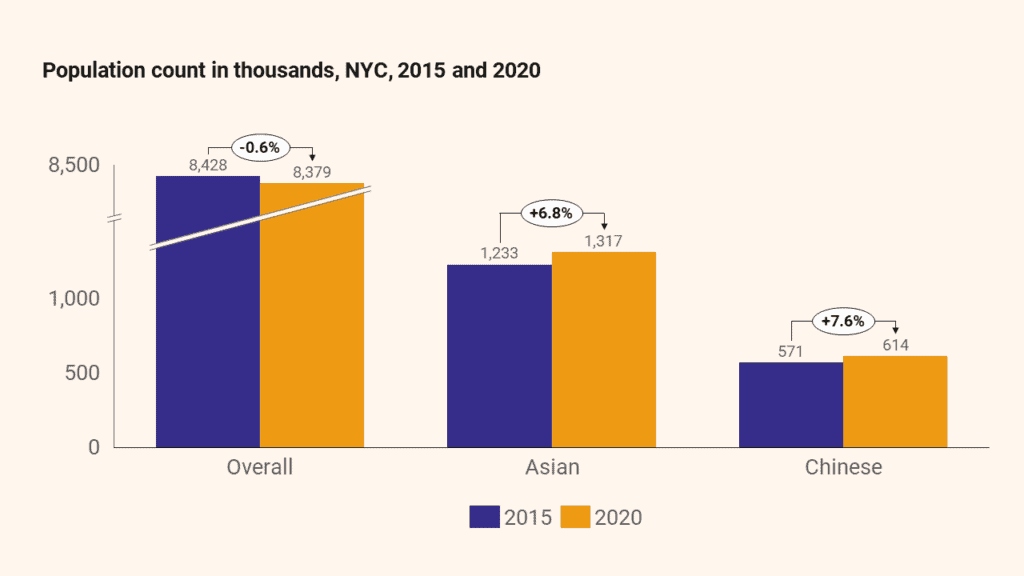
The Chinese1 population in NYC grew rapidly between 2015 and 2020, primarily within Staten Island, Queens, and the senior (65+) population. During this time, the Chinese population in NYC grew by 7.6%, a faster rate than both the City (-0.6%) and Asian2 population (6.8%).
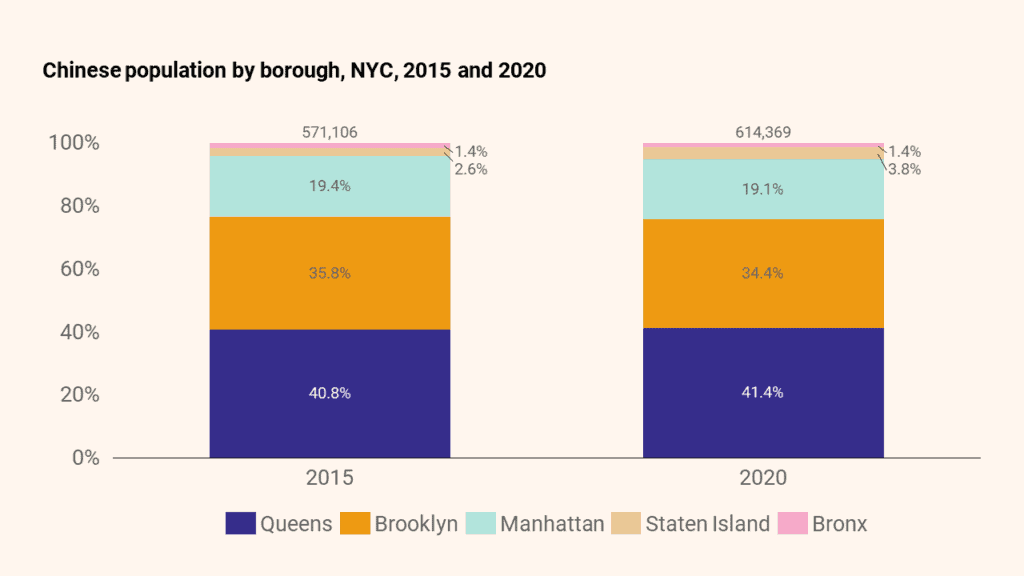
The Chinese population’s residence by borough did not significantly alter between 2015 and 2020. The population’s movement away from Brooklyn (-1.5 percentage points) toward Staten Island (+1.2 percentage points) and Queens (+0.6 percentage points) was the most notable change. No other Asian ethnic group has as high a proportion of its population living in Brooklyn (34.4%) or as low a proportion living in the Bronx (1.4%).
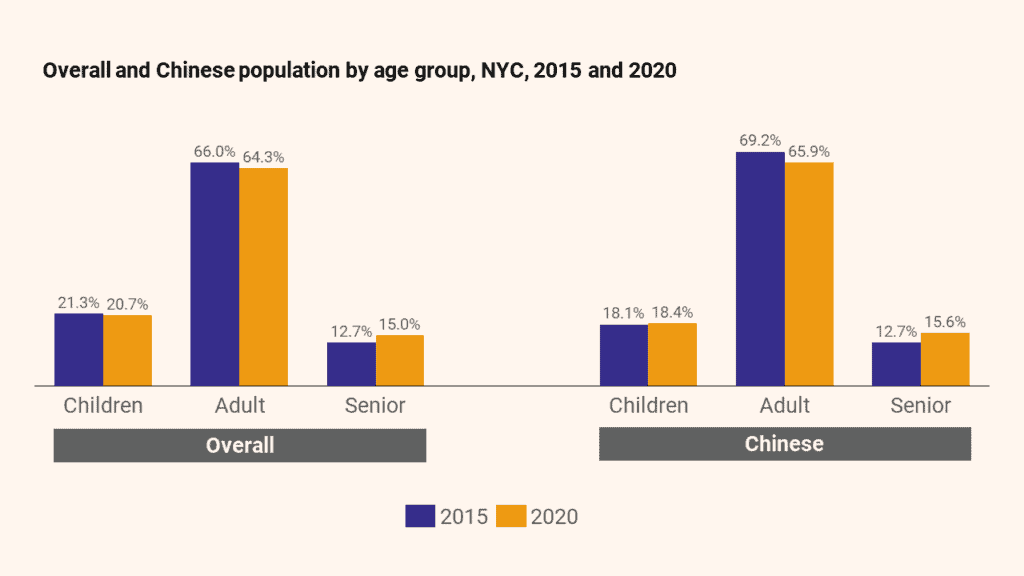
Compared to other Asian ethnic groups, the Chinese population in NYC has the highest proportion of seniors (15.6%), and the share of seniors in the overall Chinese population is growing: they now are 2.9 percentage points more of the total Chinese population than they were in 2015. The Chinese population is aging faster than the broader NYC population, whose senior population grew by 2.2 percentage points.
Working-age Chinese adults (18-64) declined by 3.3 percentage points (vs. -1.7 for NYC overall). However, the number of Chinese children under 18 rose by 0.3 percentage points (compared to a fall of 0.5 in NYC overall).
JUMP TO: Population | Immigration, Citizenship, Mobility | Education & English | Income & Poverty | Benefits & Health | Employment | Housing | Technology
Immigration, Citizenship, & Mobility
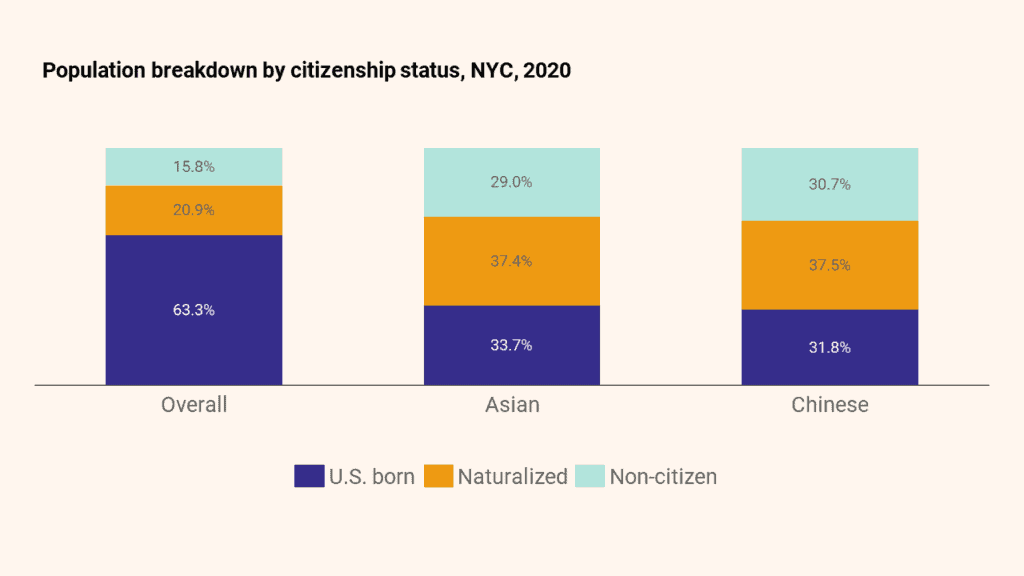
The percentage of Chinese citizens born in the United States is the lowest (31.8%) compared to other Asian ethnic groups in NYC. Of the total Chinese population in NYC, 31.8% are U.S.-born, 37.5% are naturalized citizens, and 30.7% are non-citizens. In contrast, most people in NYC became citizens by birthright (63.3%) and naturalization (20.9%). Some 15.8% of New Yorkers are non-citizens.
Only one-third (36.7%) of New Yorkers, in general, are foreign-born, while more than two-thirds (68.2%) of Chinese residents are. This is the highest foreign-born rate among Asian ethnic groups in NYC.
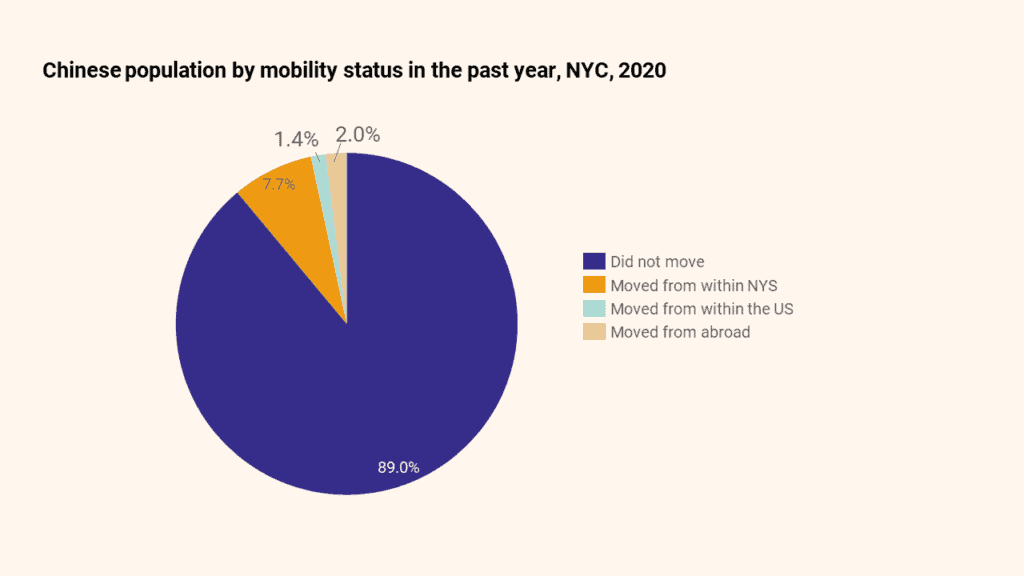
9.5% of foreign-born Chinese arrived in the City within five years of the survey, in line with the City’s 9.5% estimate. However, only 2.0% of the overall Chinese population had relocated to NYC from abroad within one year of the survey. In comparison, most Chinese (89.0%) had not moved from their previous residence in the City.
JUMP TO: Population | Immigration, Citizenship, Mobility | Education & English | Income & Poverty | Benefits & Health | Employment | Housing | Technology
Education & English
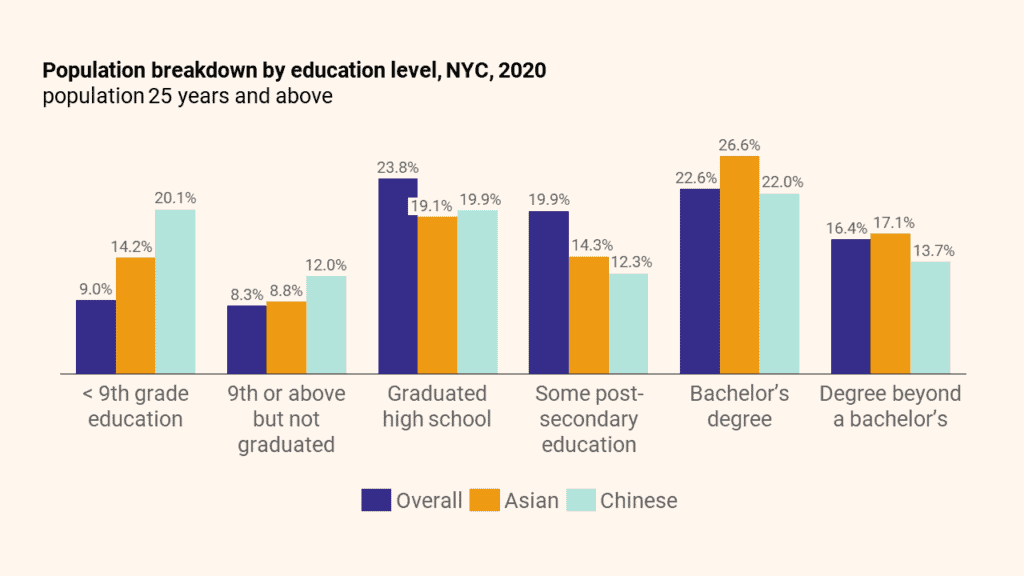
Chinese residents in NYC aged 25 and older have differing levels of education, with one-third (32.0%) not having completed high school and another one-third (35.8%) having earned a bachelor’s degree or above. Compared to the City as a whole, where only 17.3% of adults over 25 have less than a high school diploma and 39.0% have a bachelor’s degree or higher, the Chinese have lower educational attainment. In comparison to other Asian ethnic groups, the Chinese population has the highest percentage of adults with less than a 9th-grade education (20.1%) or who did not graduate from high school (12.0%), and the lowest percentage of adults with a bachelor’s degree (22.0%) or higher (13.7%).
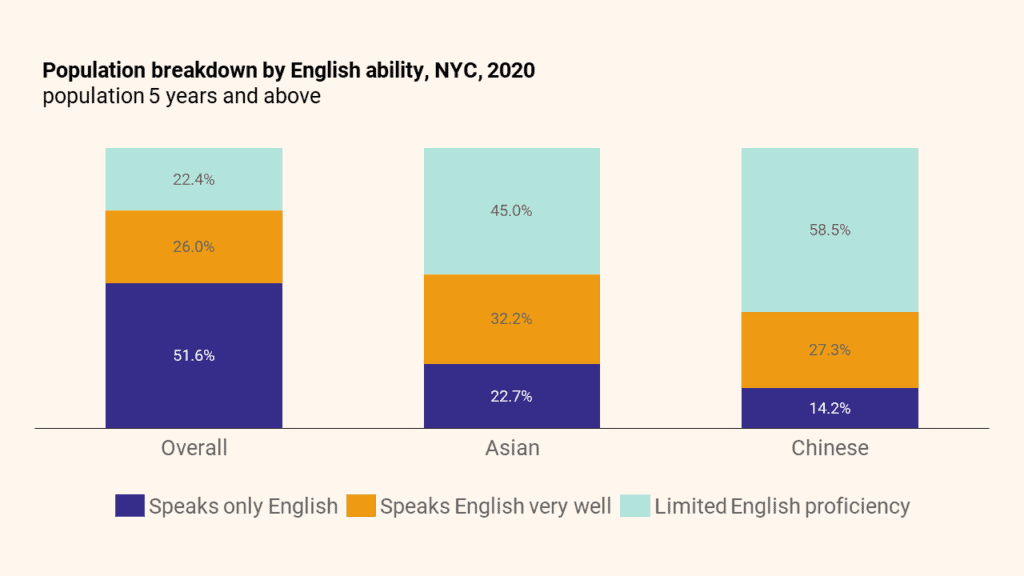
The Chinese community’s English proficiency levels are low, with 58.5% of Chinese over the age of 5 considered to have limited English proficiency (LEP). This is more than double the City’s 22.4% rate and the highest rate observed among Asian ethnic groups. Similarly, the Chinese population has the lowest proportion of speakers who speak English very well (27.3%).
The LEP rate is lower for Chinese children (5+ but under 18) at 30.3% but significantly higher for Chinese seniors (age 65+) at 86.3%.
JUMP TO: Population | Immigration, Citizenship, Mobility | Education & English | Income & Poverty | Benefits & Health | Employment | Housing | Technology
Income & Poverty
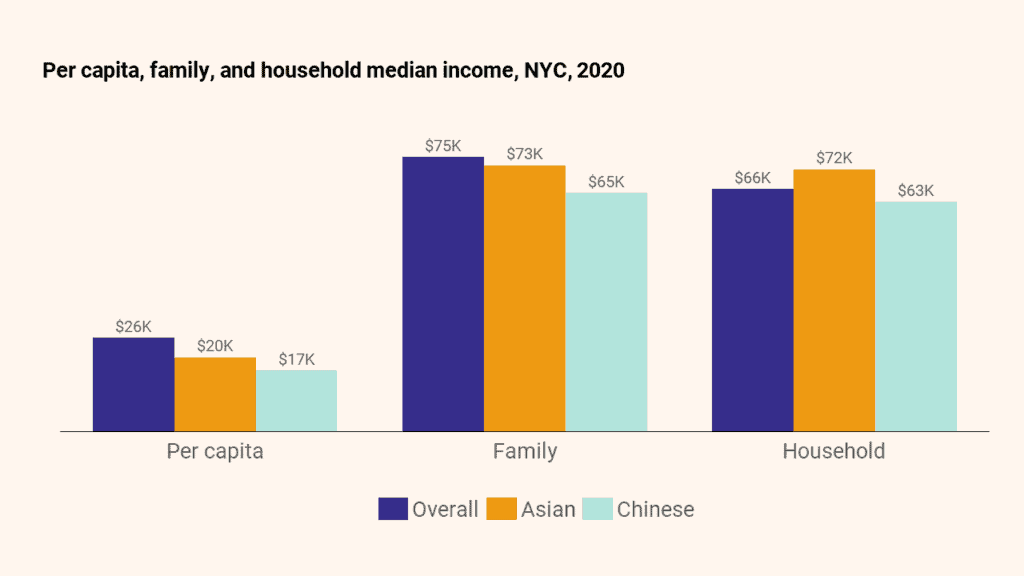
Chinese per capita median income is nearly one-third lower than the New York City median. Chinese New Yorkers also have the lowest per capita, family, and household median incomes across Asian ethnic groups.
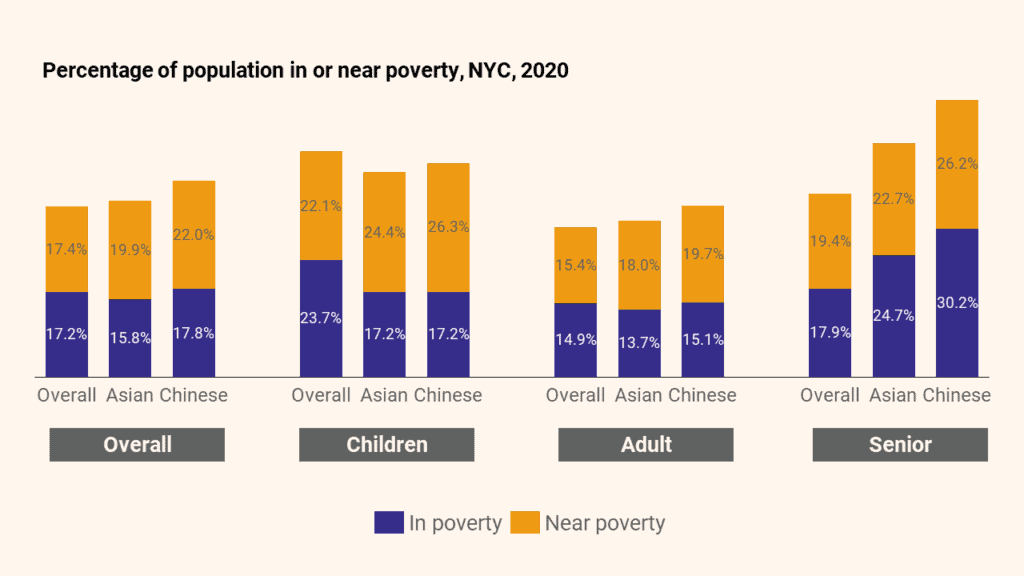
Compared to other Asian ethnic groups, the Chinese have the largest percentage of their population living in or near poverty (39.8%). These above-average Chinese poverty rates are driven by the senior (65+) population: over half (56.4%) of Chinese seniors live either in poverty or near poverty, almost double the rate of seniors in New York City as a whole (37.3%).
JUMP TO: Population | Immigration, Citizenship, Mobility | Education & English | Income & Poverty | Benefits & Health | Employment | Housing | Technology
Benefits & Health

Chinese households3 are enrolled in SNAP at about the same rate as New York City households overall, but their enrollment rates (18.9%) are the highest among Asian ethnic groups.
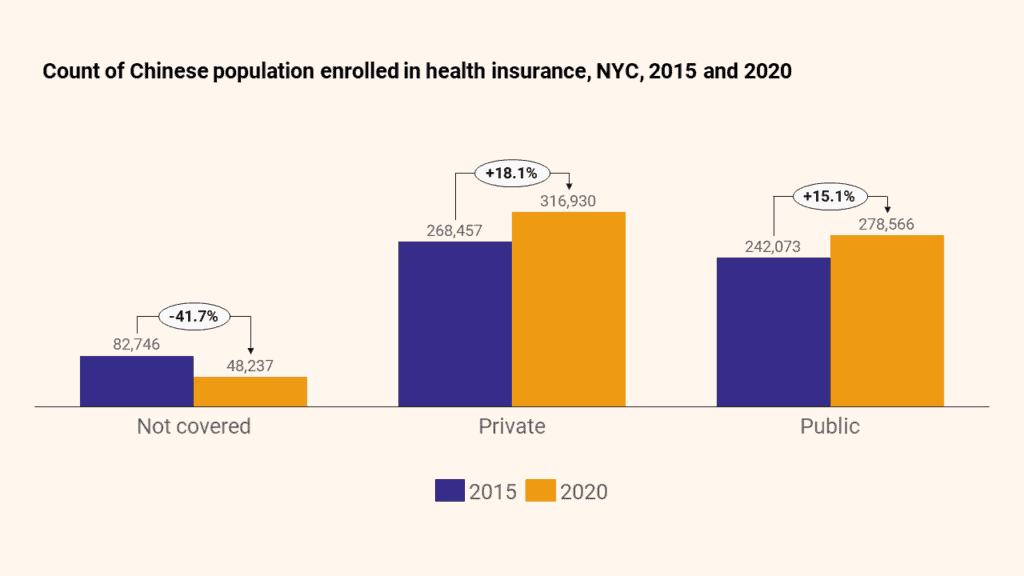
The Affordable Care Act has significantly reduced the number of uninsured in NYC, and the Chinese population is no exception. Between 2015 and 2020, 41.7% fewer Chinese people were uninsured. Among Asian ethnic groups, the Chinese population had the highest proportion of people enrolled in public health insurance (45.3%) and the lowest proportion in private health insurance (51.6%).
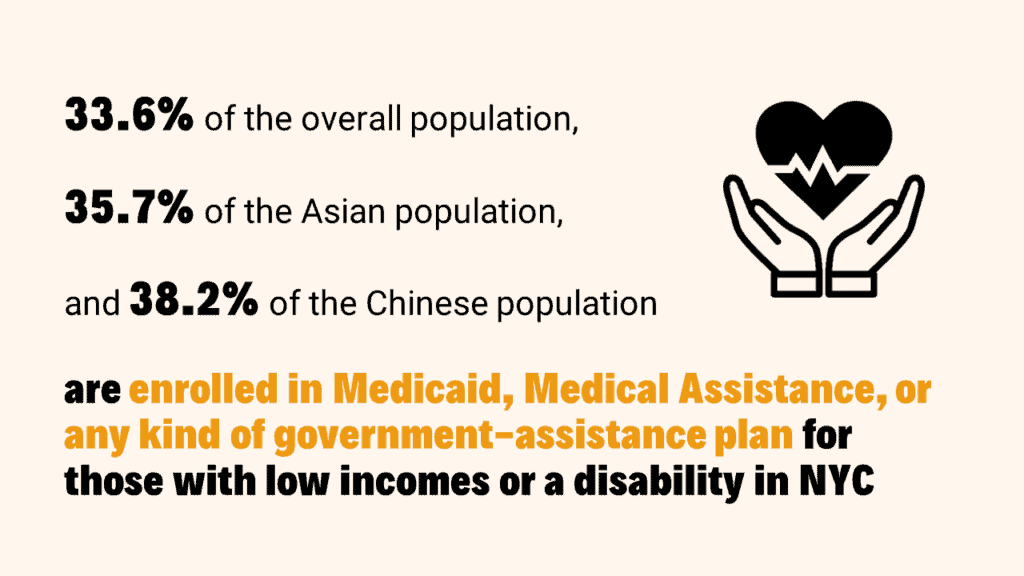
Compared to other Asian ethnic groups, the Chinese population has the highest proportion of people enrolled in government-assisted health insurance (38.2%).
JUMP TO: Population | Immigration, Citizenship, Mobility | Education & English | Income & Poverty | Benefits & Health | Employment | Housing | Technology
Employment
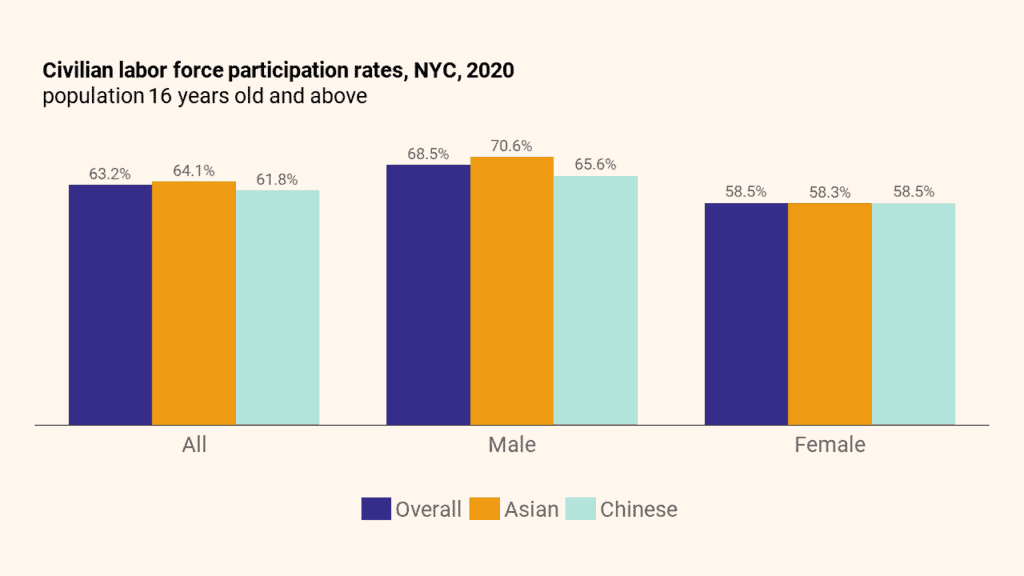
Female Chinese labor force participation rates are at par with the City overall, while male Chinese rates are slightly below average. Chinese labor force participation rates overall (61.8%) and for male workers (65.6%) are the lowest among other Asian ethnic groups.
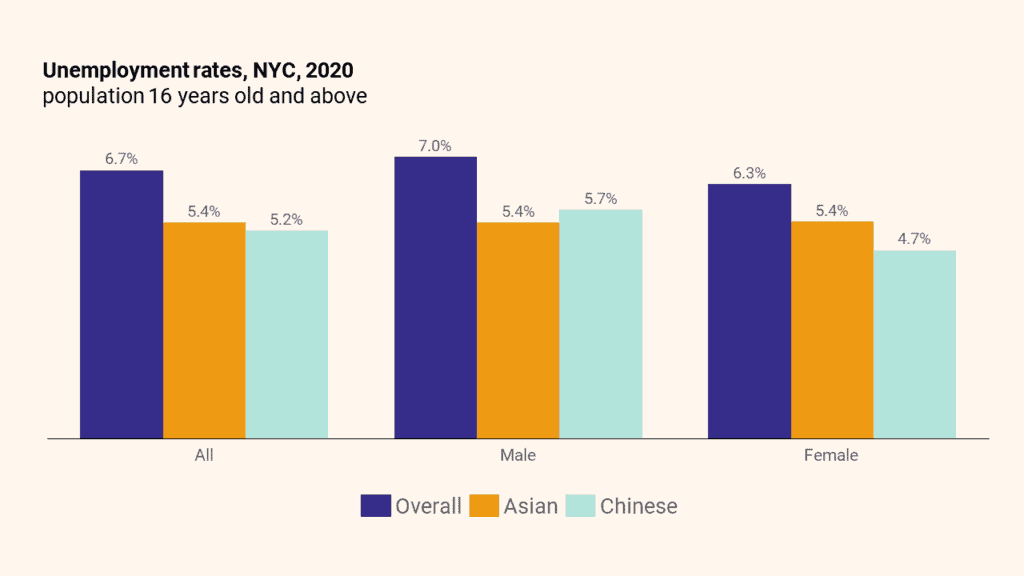
Chinese unemployment rates are lower than City rates across the board.
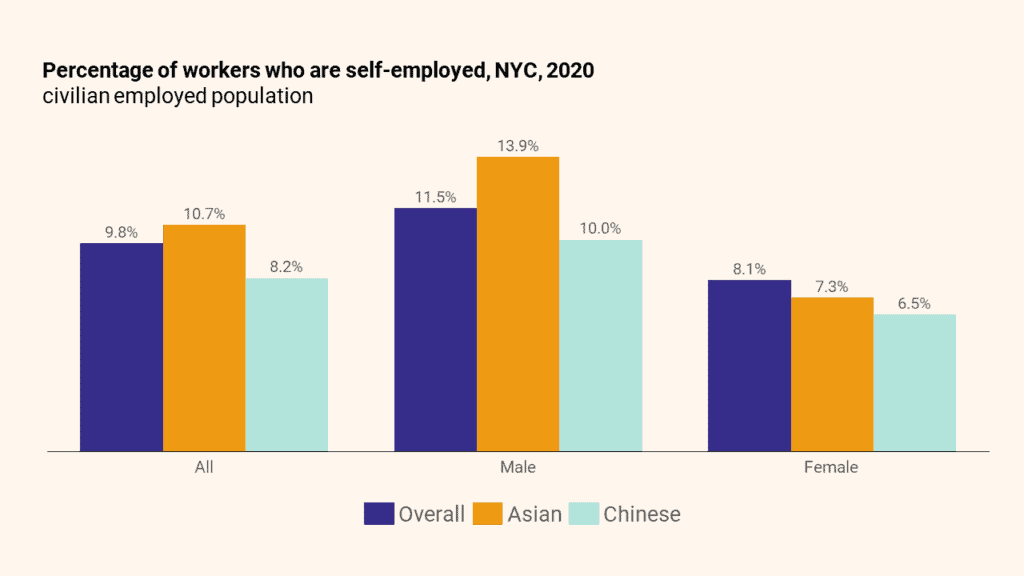
Male Chinese employees are likelier to be self-employed compared to female Chinese employees; however, Chinese employees tend to have lower rates of self-employment than both the general and Asian populations. Self-employment rates for Chinese women (6.5%) are the lowest among other Asian ethnic groups.
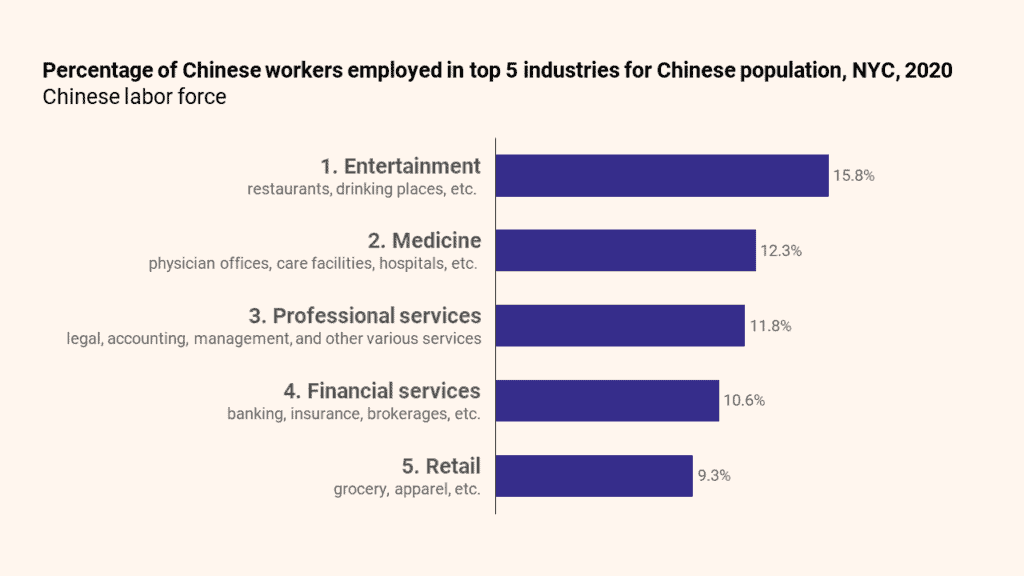
Five industries employ over half (59.8%) of the Chinese labor force. The entertainment sector employs the most Chinese at 15.8%. Over 80% of Chinese workers employed in entertainment work in restaurants and other food services, followed by traveler accommodations and other amusement, gambling, and recreation industries.
JUMP TO: Population | Immigration, Citizenship, Mobility | Education & English | Income & Poverty | Benefits & Health | Employment | Housing | Technology
Housing
Average household size, NYC, 2015 and 2020
| Household group | 2015 | 2020 |
| Overall | 2.65 | 2.57 |
| Asian | 3.10 | 2.98 |
| Chinese | 3.05 | 2.91 |
Chinese households3 in 2020 had a larger average household size than City households (2.91 people versus 2.57 people). In general, average household sizes have decreased in New York City since 2015, and Chinese households are no exception.
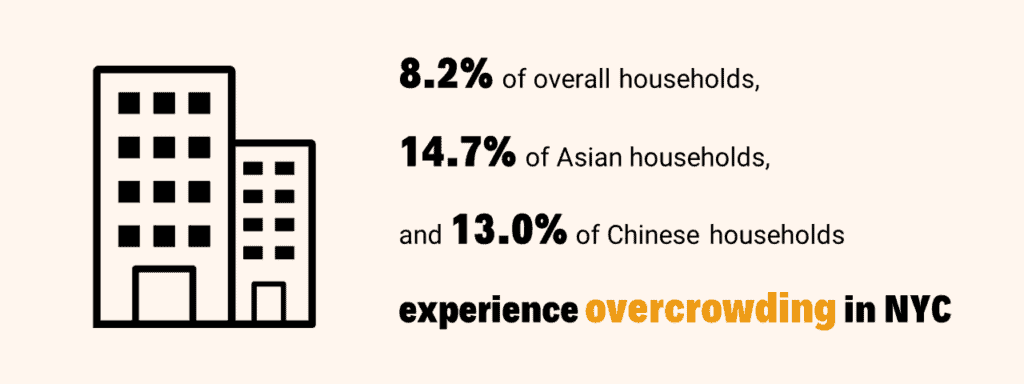
Chinese households3 are more likely to be overcrowded than City households, with 13.0% of Chinese households experiencing overcrowding.
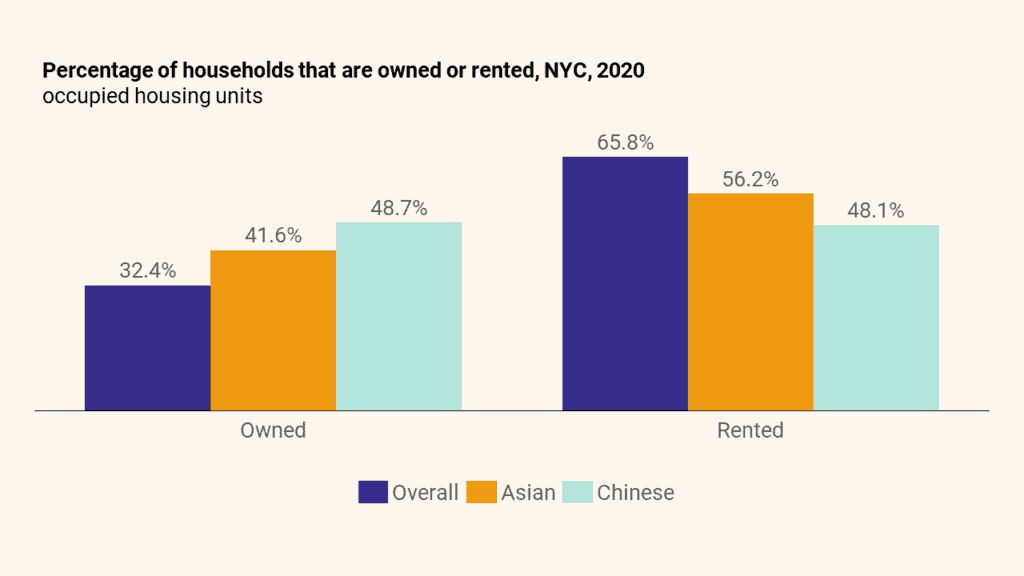
Chinese households3 own their homes at a higher rate and rent at a lower rate than City and Asian households. While almost two-thirds (65.8%) of the City rent, Chinese households are evenly split between homeownership and renting. Chinese households have the highest rate of homeownership (48.7%) and lowest rates of renting (48.1%) compared to other Asian ethnic groups.
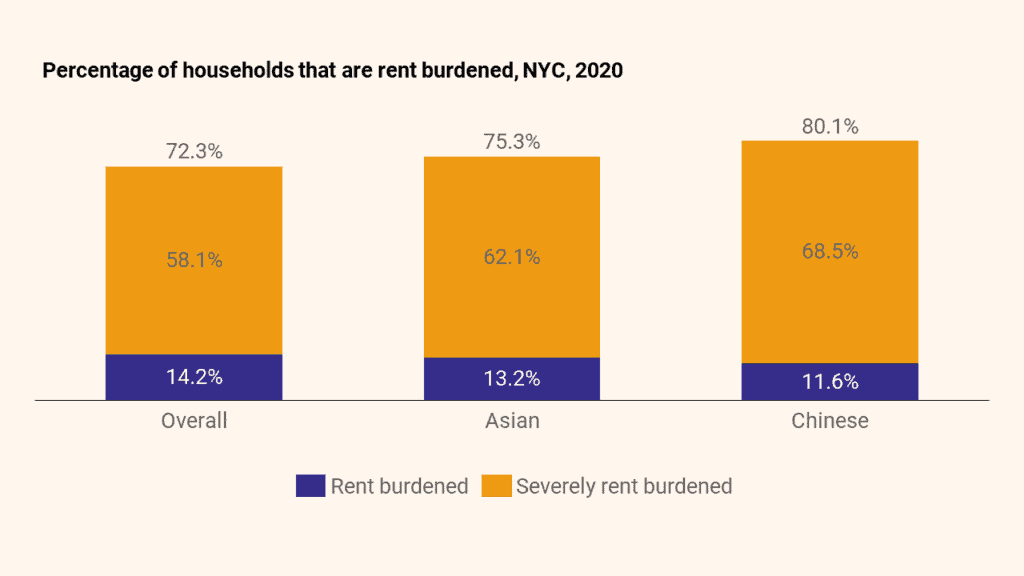
While a smaller percentage of Chinese households3 rent, the ones that do tend to be severely rent burdened. 80% of rented Chinese households are rent burdened in some capacity, with the majority qualifying as severely rent burdened. These rates are higher than City (72.3% of rented households qualify as rent-burdened) and Asian households (75.3%). Chinese households have the highest proportion of severely rent-burdened renters (68.5%) compared to other Asian ethnic groups.
JUMP TO: Population | Immigration, Citizenship, Mobility | Education & English | Income & Poverty | Benefits & Health | Employment | Housing | Technology
Technology
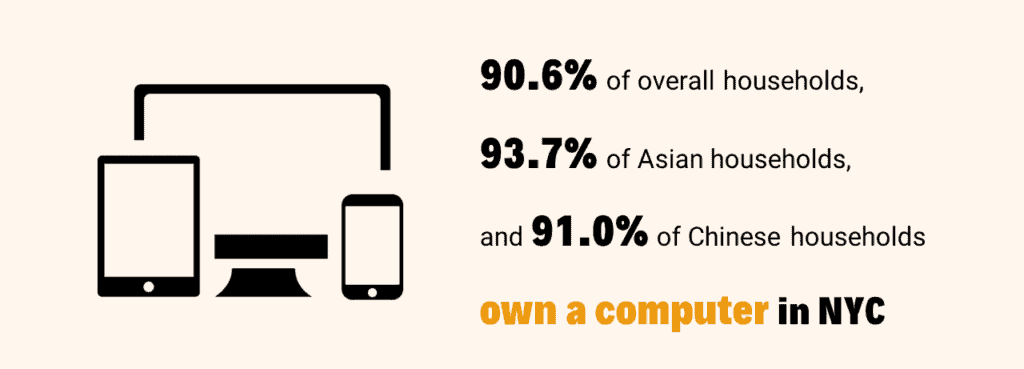
Chinese households3 report owning a computer at similar rates to City households. However, Chinese rates of computer ownership (91.0%) are the lowest among Asian ethnic groups.

Chinese households3 also report having internet access at similar rates to City households. However, Chinese internet access rates are the lowest (86.9%) among Asian ethnic groups.
JUMP TO: Population | Immigration, Citizenship, Mobility | Education & English | Income & Poverty | Benefits & Health | Employment | Housing | Technology