State of Change: Asian Populations Transform New York
KEY FINDINGS
The Asian American population of New York increased by 37.6 percent.
In 2020, Asian Americans were 10.8 percent of New York State’s population.
The number of Asian children in New York went up by 32.4 percent – and Asian children are driving population growth in many areas.
New York City had the state’s largest Asian community.
Outside of the City, the Asian American population has grown quickly, more than doubling in size in several areas.
Indians and Chinese continue to be the largest Asian communities in New York.
Bangladeshi, Burmese, Nepali, and Pakistani populations have also increased in New York as a result of refugee resettlement and recent migration.
The release of 2020 Census redistricting files gives us our first opportunity to explore demographic changes for Asian Americans in New York over the last decade. This brief examines Asian American population growth and shifts in cities, towns, and localities across the state.
The data shows that upstate New York experienced Asian population growth in ways similar to New York City.
- Asian children, refugees and immigrants drove growth in Asian American communities across the state.
- Limited English proficiency and high poverty rates among Asians were found across communities in upstate New York.
Asian Population in New York City and State: A State of Growth
- The Asian American population in New York State increased by 37.6 percent, growing from 1,579,494 in 2010 to 2,173,719 in 2020.
- Asian Americans made up 10.8 percent of the total population of New York State in 2020, up from 8.2 percent in 2010.
- The state’s population of Asian children increased 32.4 percent in the last decade compared to a 4.9 percent decrease in the population of all children.
- New York City was home to the largest Asian community in the state, with 1,525,851 residents who made up 17.3 percent of the city’s population.
As shown in Table 1, if the boroughs of New York City were their own cities, they would still rank among the top ten places in the State, in terms of numeric Asian population growth and population size. However, calculating population growth as a percentage change revealed rapidly growing areas outside of New York City, as discussed in the following section.
Table 1. Greatest Numeric Changes in New York’s Asian Population, 2010- 2020
| Locality | Numeric Change | Asian Population in 2020 |
|---|---|---|
| Queens borough, Queens County | 153,106 | 705,973 |
| Brooklyn borough, Kings County | 135,037 | 419,526 |
| Manhattan borough, New York County | 54,721 | 254,443 |
| Staten Island borough, Richmond County | 25,544 | 64,300 |
| Hempstead town, Nassau County | 23,952 | 69,064 |
| Bronx borough, Bronx County | 22,524 | 81,609 |
| North Hempstead town, Nassau County | 21,768 | 58,741 |
| Oyster Bay town, Nassau County | 20,802 | 50,005 |
| Buffalo city, Erie County | 13,689 | 23,387 |
| Brookhaven town, Suffolk County | 5,917 | 27,766 |
| Amherst town, Erie County | 5,878 | 16,561 |
A Rapidly Growing Asian Population Outside NYC
The Asian American population grew quickly over the past decade in areas outside of the city, with several localities more than doubling in population.
- Several towns in Nassau County (Table 1) experienced the highest numeric growth amongst all of New York State’s localities.
- In Erie County, the town of Cheektowaga and the city of Buffalo saw jumps of 145.9 and 141.2 percent, respectively, in the Asian population.
- In the town of Halfmoon in Saratoga County, the Asian population increased by 111 percent.
- In the town of Salina in Onondaga County, Asians increased by 107 percent.
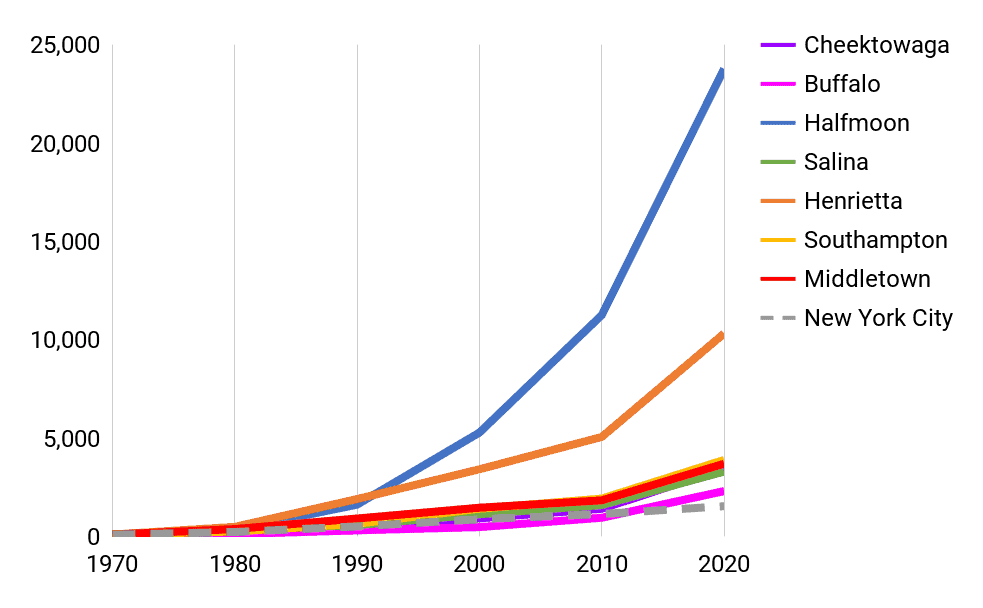
Figure 1 depicts how much of the growth in the Asian population occurred in the last decade. Especially in Buffalo, where the Asian population grew at a slower rate than the rest of the state and New York City until 2010, only to then surpass both in 2020.
Figure 1. Asian Population Change from 1970 to 2020 (Indexed to 1970)
The share of the Asian American population increased in localities that experienced significant population growth, contributing to the changing demographics of these areas.
- In Scarsdale, Westchester County, and North Hempstead, Nassau County, nearly a quarter of the population was Asian. These towns also experienced the largest change in the Asian share of population between 2010 to 2020 (Table 2).
- The city of Utica in Oneida County, the town of Henrietta in Monroe County, and Buffalo surpassed almost all localities with both a relatively large change in the total share of the Asian population and high population growth – over 75 percent.
Table 2. Greatest Change in Asian Share of Population, 2010-2020
| Locality | Asian Share of Population in 2020 | Change in Asian Share (2010-2020) |
| Scarsdale town, Westchester County | 24% | +9% |
| North Hempstead town, Nassau County | 25% | +8% |
| Henrietta town, Monroe County | 15% | 7% |
| Oyster Bay town, Nassau County | 17% | +7% |
| Utica city, Oneida County | 14% | +6% |
| New Castle town, Westchester County | 14% | +5% |
| Colonie town, Albany County | 12% | +5% |
| Staten Island borough, Richmond County | 13% | +5% |
| Buffalo city, Erie County | 8% | +5% |
| Queens borough, Queens County | 29% | +5% |
Asian Children Drove Population Growth in Urban Areas Across the State
Asian American children drove Asian population growth in several localities across the state that were identified as hotspots for Asian growth.
Table 3 shows the areas where Asian children accounted for more than one-fifth of total Asian population growth. In the 2020 Census, children made up one-fifth of the population in New York State overall.
- Table 3 shows that the fastest growing localities were in the metro areas of Albany, Buffalo, Syracuse, and Utica.
- Select downstate areas where Asian children were a key driver of overall population growth included Harrison and Scarsdale in Westchester County, and the towns of Oyster Bay and North Hempstead in Long Island’s Nassau County.
- The highest numeric changes in New York City’s Asian child population took place in Brooklyn with an increase of 27,539 children followed by 19,891 in Queens (not shown in Table 3). However, children were not a disproportionately large part of the Asian population growth in the city.
Table 3. New York’s Asian Population Growth due to Children, 2010-2020
| Locality | Population Growth due to Asian Children | Numeric Growth in Asian Children |
| Harrison town, Westchester County | 43% | 549 |
| Scarsdale town, Westchester County | 39% | 729 |
| Utica city, Oneida County | 37% | 1,412 |
| Buffalo city, Erie County | 37% | 5,011 |
| Cheektowaga town, Erie County | 30% | 696 |
| Syracuse city, Onondaga County | 28% | 734 |
| Oyster Bay town, Nassau County | 27% | 5,688 |
| Greenburgh town, Westchester County | 26% | 887 |
| Colonie town, Albany County | 25% | 1,103 |
| North Hempstead town, Nassau County | 24% | 5,308 |
| Schenectady city, Schenectady County | 23% | 692 |
| Hempstead town, Nassau County | 22% | 5,354 |
| Bronx borough, Bronx County | 22% | 4,920 |
| Albany city, Albany County | 22% | 759 |
| Staten Island borough, Richmond County | 21% | 5,459 |
| Brooklyn borough, Kings County | 20% | 27,539 |
| Amherst town, Erie County | 20% | 1,179 |
More Immigration Driving Higher Poverty and Limited English Proficiency Rates Outside of NYC
If we examine the localities with the greatest change in Asian population presented in Table 2, we see three overall trends in Table 4.
- High poverty and limited English proficiency (LEP) rates above 50 percent were found among upstate localities, with poverty rates as high as 35 percent in Utica, 49 percent in Buffalo, 25 percent in the town of Ithaca, and 48 percent in the town of Vestal.
- Low poverty rates and LEP rates below 50 percent were found among towns in the New York City metro area.
- The five boroughs of New York City had comparatively lower poverty rates than several high poverty upstate areas, but had LEP rates above 50 percent.
Table 4. Selected Characteristics of New York Areas with the Greatest Change in Asian Population Share
| Locality | Poverty Rate | LEP Rate | Top Ethnicities |
| Scarsdale town, Westchester County | 3% | 33% | Chinese; Asian Indian; Korean |
| North Hempstead town, Nassau County | 4% | 43% | Chinese; Asian Indian; Korean |
| Henrietta town, Monroe County | 20% | 58% | Asian Indian; Chinese; Nepalese |
| Oyster Bay town, Nassau County | 4% | 43% | Asian Indian; Chinese; Korean |
| Utica city, Oneida County | 35% | 67% | Burmese; Thai; Vietnamese; Cambodian |
| New Castle town, Westchester County | 5% | 25% | Chinese; Korean; Asian Indian; Taiwanese |
| Colonie town, Albany County | 9% | 45% | Asian Indian; Chinese; Pakistani |
| Staten Island borough, Richmond County | 11% | 53% | Chinese; Asian Indian; Filipino |
| Buffalo city, Erie County | 49% | 55% | Asian Indian; Burmese; Chinese |
| Queens borough, Queens County | 14% | 65% | Chinese; Asian Indian |
Recent Migration and Refugee Resettlement Increased Asian Diversity Upstate
While we await the release of detailed Asian ethnic group data from the 2020 Census, this brief will use ACS data to provide insights into which Asian ethnicities were driving population growth across the state.
While Indians and Chinese continued to be the most populous Asian groups across New York State, trends such as refugee resettlement and recent migration contributed to increasing diversity among Asian groups in upstate New York.
- In Utica, almost half (48 percent) of the Asian population was Burmese. Due to refugee resettlement, Utica was home to a significant Karen community, an ethnic group largely from Myanmar (Burma), who are currently classified as Burmese in Census data.
- In Buffalo, Burmese made up 20 percent of all Asians, as a result of migration of Karen and other refugees from Myanmar. Buffalo also saw Bangladeshis emerge as 10 percent of the Asian population, resulting from migration to the area from New York City in recent years.
- Pakistanis made up 11 percent of Asians in the town of Colonie, in Albany County;
- Nepalese, who largely came to the United States in the last ten years, made up 12 percent of Asians in the town of Henrietta, in Monroe County.
Technical Notes
Our population analysis looked at the Asian Alone or in Combination census category which includes anyone who identifies as Asian in any way. We analyzed 2020 Census data by county subdivisions which consist of cities, towns, and other legal units across the entire state of New York; including New York City’s five boroughs. This report refers to these geographic areas as localities.
Data on Asian ethnic groups, poverty and limited English proficiency were derived from the 2019 Five-Year American Community Survey (ACS) data tables from the Census Bureau. Since the Census Bureau has yet to release detailed 2020 data for Asian ethnic groups, the ACS remains the most complete data source on Asian populations by ethnic group. ACS data tables were only available for the Asian Alone census category, which covers people who identify as Asian only.