The Hidden Poverty of the “Model Minority”
Introduction
There is a widespread and harmful belief that Asian Americans are uniformly high-achieving, financially and academically. However, more than one in three Asian New Yorkers are low-income and are one of the most economically divided groups in New York City. The city’s Asian American community consists of over 20 distinct ethnic groups with diverse languages and cultures, with some ethnic groups within the larger community being significantly poorer than others. While two-thirds of Asian New Yorkers are immigrants, the community also includes those whose families have been in America for many generations.
Low-income Asian New Yorkers face a variety of challenges. Asian children and seniors, especially those who are not proficient in English, are more likely to be low-income than other age groups. In addition, when compared to other New Yorkers, attaining higher levels of education and having citizenship makes a substantial difference in an Asian person’s income and earnings. The cost of living in the city is also higher than in other areas in the United States, making it a challenge for low-income Asian households to make ends meet. Despite a higher cost of living, the median income for Asian households in New York City is much lower than the median income for Asian households across the entire country, a fact that once again points to the significant discrepancies in earnings across the community.2
Asian Americans in New York City have complex and varied economic challenges that are best understood and addressed by acknowledging that the community is not a singular, monolithic entity, but rather one that has diverse experiences, cultures, and socio-economic circumstances. It is only then that we can begin to dismantle some of the inequities that have adversely affected the community’s progress.
Key Terminology
Low Income: Being in poverty means having an income below the OPM poverty threshold, as defined by the U.S. Census Bureau. Being near poverty means having an income below 200% of the OPM poverty threshold as defined by the U.S. Census Bureau.1 This brief defines those who are either in or near poverty as low-income.
Race Category: Major racial and ethnic groups in this brief include the following: Asian alone or in combination, Black alone or in combination, Hispanic alone or in combination, Non-Hispanic White alone or in combination with other racial and/or ethnic groups. The concept race “alone or in combination” (AOIC) includes people who reported a single race alone (e.g., Asian) and people who reported that race in combination with one or more of other race groups (e.g., White, Black or African American, American Indian and Alaska Native). The concept “race alone or in combination,” therefore, represents the maximum number of people who reported as that race group, either alone or in combination with one or more additional race(s). The sum of the individual race “alone-or-in-combination” categories may add to more than the total population because people who reported more than one race were tallied in each race category. Locations with larger numbers of individuals choosing the “multiple races category”, will find a more complete description of their population in the AOIC reports.
Limited English Proficiency (LEP): Individuals with Limited English Proficiency or LEP reported speaking English less than “very well”. They reported speaking English “well”, “not well”, or “not at all” on the American Community Survey. An LEP household is defined as a household where no household member can speak English at least very well. A non-LEP household is defined as a household where at least one household member 14 years or older can speak English very well or speaks English only.
Recent Immigrants: Recent immigrants are those who immigrated to the U.S. 5 or less years before submitting the survey (American Community Survey). Those who arrived in the U.S. more than 5 years before the year they took the survey are considered earlier immigrants in this brief.
Model Minority Myth: The stereotype that portrays people of Asian descent as uniformly more hardworking, successful and high-achieving than other racial/ethnic groups, typically in education and financially.
Poverty Measures
This brief uses the 2017-2021 American Community Survey’s 5-Year Public Use Microdata Sample (PUMS) in which poverty is defined by the federal poverty line, the official poverty measure (OPM). The OPM is, however, limited in that it does not consider differences in cost of living by geographic location and is based on minimal nutritional costs, income before taxes, and does not account for public assistance benefits. Other existing poverty measures include the Supplemental Poverty Measure (SPM), the New York City Government (NYCGov) Poverty Measure, and the True Cost of Living (TCL), which can be found in Table 1. The SPM, developed by the Census Bureau and based on recommendations from the National Academy of Sciences, differs from the OPM by taking geographical differences in housing costs, taxation, and public assistance benefits into account. The city’s Poverty Research Team updates the NYCGov Poverty Measure yearly, which is based on the SPM’s guidelines and also considers relatively high local housing costs as well as additional expenses such as childcare, commuting, and medical out-of-pocket costs.3 The True Cost of Living report, written by the Center for Women’s Welfare at the University of Washington School of Social Work, accounts for geography down to the borough and within-borough level, similar basic needs as the NYCGov Poverty Measure, and does not consider public assistance in order to reflect costs without reliance on benefits.
Table 1. Comparison of Existing Poverty Measures
| Official Poverty Measure (OPM) by the U.S. Census Bureau | Supplemental Poverty Measure (SPM) by the U.S. Census Bureau | New York City Government Poverty Measure by the NYC Opportunity | True Cost of Living (TCL) by the Center for Women’s Welfare at the University of Washington School of Social Work |
| Developed in 1960s | Adjusts for differences in housing costs by geography | Accounts for housing costs in NYC that are typically higher than for other geographic areas | Considers basic needs costs such as housing, child care, food, health care, transportation, and taxes |
| Threshold based on cost of minimal nutrition | Accounts for differences in housing costs by ownership status (ex. mortgage costs) | Updated yearly (most recent report was based on experimental one-year data from 2020) | Thresholds are determined without taking into account public assistance in order to reflect the ability to afford basic needs without relying on benefits |
| Assumption of nutrition making up one third of all expenses | Considers clothing, shelter, utilities, and food | Adjustments for taxation, nutritional and housing assistance, work-related expenses, and medical out-of-pocket costs | Accounts for family type |
| Varies by family size | Accounts for taxation and in-kind benefits | Based on SPM guidelines, adjusted for local cost of living | Accounts for geographic location to the borough level and within-borough areas (ex. North Manhattan and South Manhattan) |
| Does not vary geographically | |||
| Based on pre-tax income | |||
| Does not account for capital gains, in-kind benefits |
Asian Families
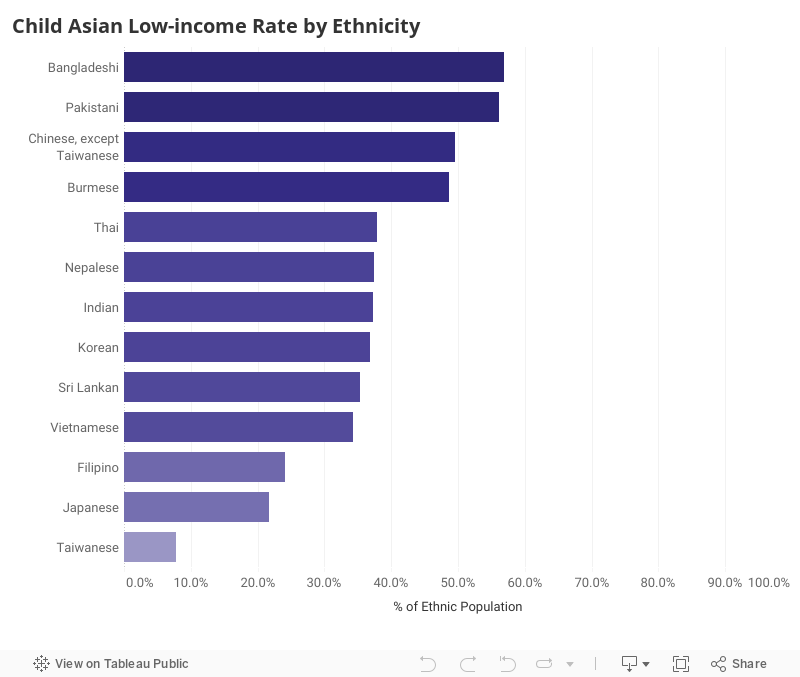
Children
In New York City, Asian children face a higher low-income rate (42.1%) compared to the broader Asian population (34.7%). Among different Asian groups, this rate varied significantly between Asian ethnic communities.
Two-Parent Households
Among two-parent households of major racial and ethnic groups, Asian households stood out with some of the highest rates of being low income.4
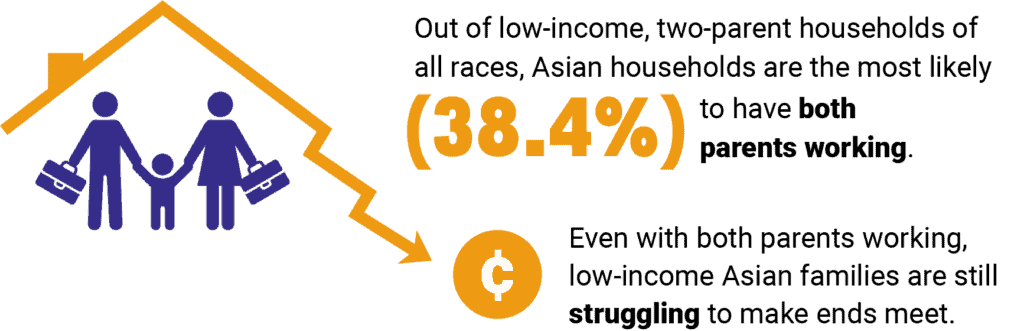
These findings correspond with those in the 2006 report Working but Poor, Asian American Poverty in New York City, which highlighted the persistent struggles of the Asian American population that, in spite of working diligently, continue to face poverty, inadequate protections, and remain trapped on the lower rungs of the economic ladder.
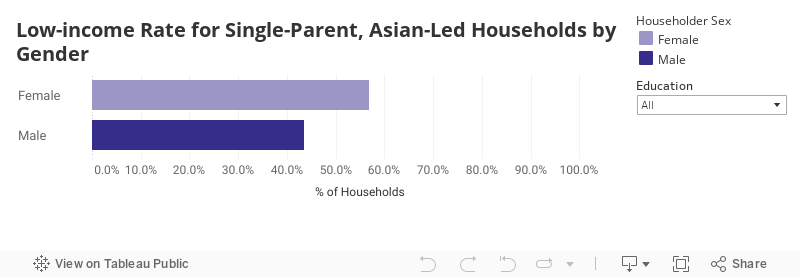
Single-Parent Households
Families led by Asian single mothers were more likely to be low-income than families headed by Asian single fathers, for all levels of education. Asian-led single parent households were in poverty at a rate of 54.4%, lower than the city’s overall 61.% poverty rate for single parent homes. This rate, however, varied significantly based on the gender of the householder.
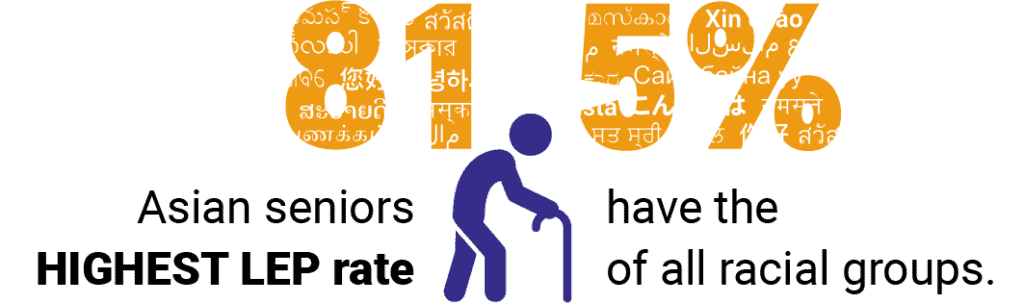
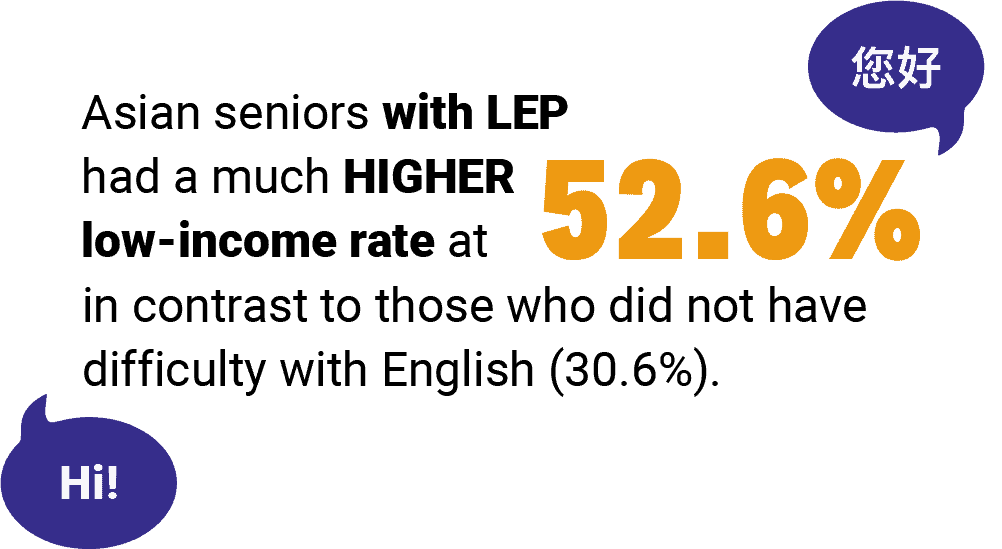
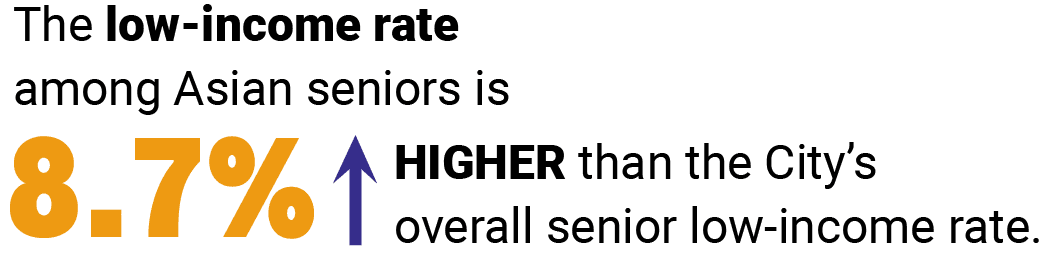
Seniors
Asian seniors were low-income at a rate higher than the city’s overall rate, and among this group, 81.5% had limited English proficiency.
Factors for Low-income and Income Disparities
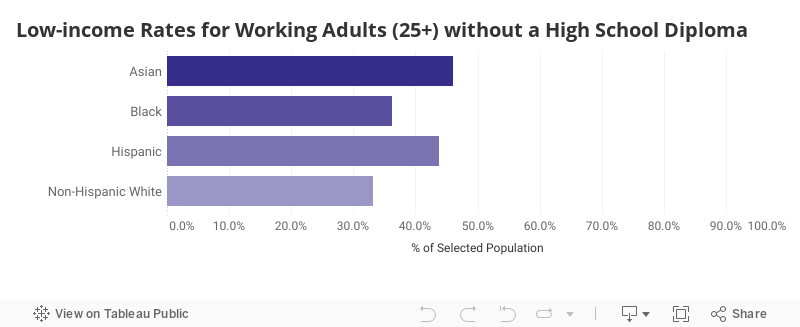
Asian working adults had the highest personal income disparity between those without a high school diploma and those with a degree beyond a bachelor’s.
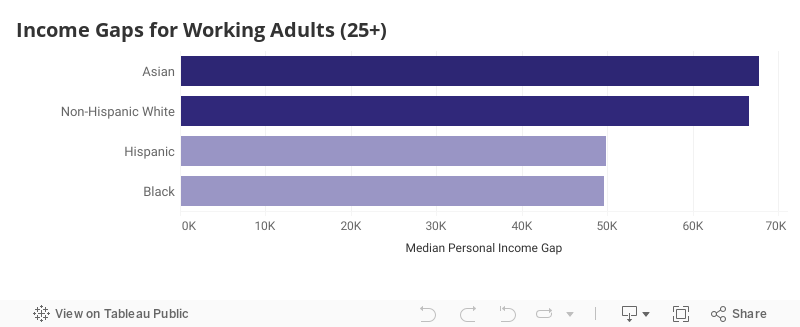
Although Asians start earning more than other groups with increased educational attainment, their income remains below that of Non-Hispanic White working adults for all levels of education.
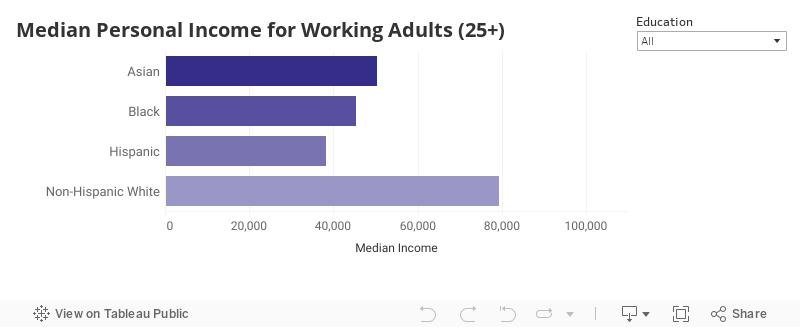
Among those without a high school diploma, Asians had the highest low-income rate compared to other major racial and ethnic groups with the same education. 46.5% of Asian working adults 25 years or older without a high school degree were low-income, followed by 44.3% of the equivalent Hispanic population but significantly greater than the equivalent Black population (36.3%) and the equivalent Non-Hispanic White population (32.8%).
Asians also had the largest disparity in median personal income between those without citizenship, naturalized citizens, and citizens by birth. Compared to Asian citizens by birth and naturalized citizens who had median personal incomes of $75,951 and $49,424, respectively, Asians without citizenship had a significantly lower median personal income of $33,490. Asians with citizenship by birth were the second highest earners behind Non-Hispanic White citizens by birth, earning about 90% of the latter group’s median personal income. However, for those without citizenship, Asians only earned about half of what Non-Hispanic White non-citizens earned.

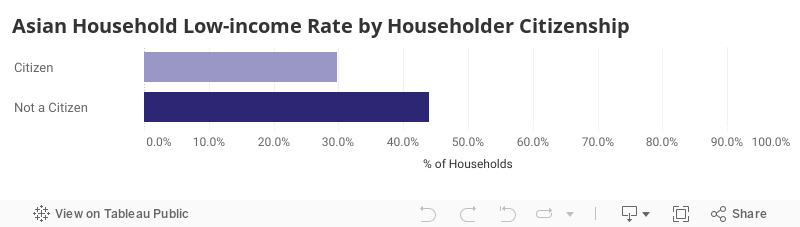
Being low-income was more prevalent for households led by non-citizens compared to citizens. Among Asian households, those headed by U.S. citizens had a low-income rate of 29.9%. However, this rate increases to 44.0% for households led by Asians who are not U.S. citizens.
Public Assistance Enrollment
Asians are hesitant to enroll in public assistance programs, especially those with the most need. One such program, the Supplemental Nutrition Assistance Program5, or SNAP, provides food assistance to low-income New Yorkers. Non-citizens and recent immigrants had lower SNAP enrollment rates despite having higher low-income rates than naturalized citizens and earlier immigrants, respectively.
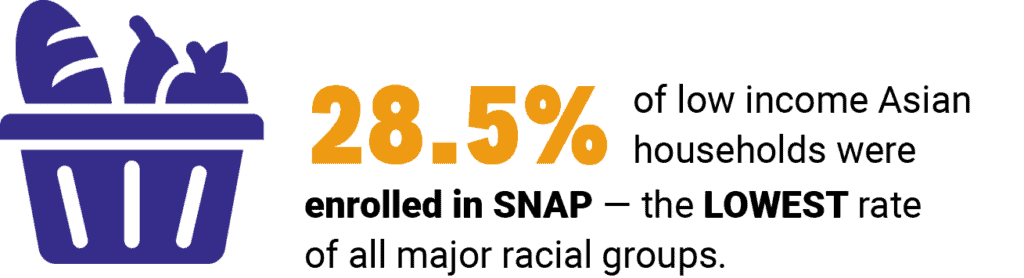
In our 2020 New York City Demographic Report, we found that Asian New Yorkers had the lowest enrollment rate in SNAP of all major racial and ethnic groups. The same was true in 2021, with 28.5% of low income Asian households being enrolled in SNAP, compared to a 49.5% enrollment rate for low income Black households, 54.0% for Hispanic households, 30.0% for Non-Hispanic White households and 42.9% for the city overall.6
When we take a closer look at SNAP enrollment by citizenship status, we find that low-income Asian households led by citizens had a higher total enrollment rate compared to equivalent households led by non-citizens. SNAP enrollment was much lower for non-citizens than for citizens despite households led by non-citizens having higher poverty and low-income rates (20.8%, 44.0%) than those led by citizens (13.5%, 29.9%).
Low-income Asian households headed by recent immigrants also had a lower enrollment rate of 14.8% compared to equivalent households led by earlier immigrants who had a 30.2% enrollment rate.7 These discrepancies may be reflective of a fear of consequences in relation to one’s immigration status as well as feelings of pride and stigma against receiving government assistance among the city’s Asian communities.8
Conclusion
Despite the narratives of academic and financial success often associated with Asian Americans in New York City, the reality is that they experience poverty and low income status in various ways. Moreover, Asian New Yorkers remain one of the most economically divided groups in the city, with significant differences in income and poverty levels among different ethnic communities. Poverty is particularly prevalent among Asian children and seniors, especially those with limited English proficiency. Factors such as education, citizenship status, and household composition play a crucial role in income and poverty disparities within the Asian community, as well as in comparison with other major racial and ethnic groups.
The analysis of poverty measures, including the federal poverty line, Supplemental Poverty Measure (SPM), New York City Government (NYCGov) Poverty Measure, and the True Cost of Living (TCL), further highlights the complexity of understanding poverty in the city. The rates may vary depending on the factors considered, such as geographical location, housing costs, and public assistance benefits. For example, while the OPM estimates 16% of Asian New Yorkers to be living in poverty in 2020, the SPM estimates 23% of Asian New Yorkers were living in poverty for that same year.9 In 2021, the OPM estimated 18.3% of AANHPI10 households were living in poverty, while the TCL report’s poverty measure places a significantly higher portion of the AANHPI population, or 51% AAPI households, in poverty.11 This variability in poverty rates shows the complexity of measuring the cost of living and how understated poverty rates for Asian New Yorkers may be.
Addressing poverty and income disparities among Asian Americans in New York City requires a comprehensive and inclusive approach. By understanding the unique challenges faced by different ethnic communities and demographic groups, policymakers and stakeholders can work towards implementing targeted interventions and policies to promote economic equality and improve the well-being of all residents.
Footnotes
- https://www.census.gov/data/tables/time-series/demo/income-poverty/historical-poverty-thresholds.html
- The median income for Asian households in New York City is $76,832; the national median for Asian households is $98,367.
- The most recent update was released for the 2020 poverty measure. We are unable to use this measure for this brief as we are using 2021 Census data.
- Within the category of two-parent households with both parents in the labor force, 27.2% of Hispanic households were low-income; 30.2% for Black households; 31.7% for Non-Hispanic White households; 31.4% for all of New York City.
- SNAP is the Supplemental Nutrition Assistance Program, more commonly known as food stamps, which provides food assistance to low-income New Yorkers. More information can be found here: https://www.nyc.gov/site/hra/help/snap-benefits-food-program.page.
- This can be attributed to the fact that low income Asian households had one of the highest estimated number of two-parent households compared to that for other major racial and ethnic groups despite having the smallest total number of low income households.
- http://aafederation.org/doc/WorkingButPoor.pdf
- Percentages are calculated by combining those with a Bachelor’s Degree and those with a Degree beyond a Bachelor’s.
- Eligibility for SNAP depends on a number of factors such as household size, income, and presence of elderly or disabled household members. We chose to look at SNAP enrollment for low-income households as most are likely to be eligible for the program.
- Recent immigrants are those who arrived within 5 years of having taken the American Community Survey. See Table 1 for more.
- Louie NT, Kim LP, Chan SE. Perceptions and Barriers to SNAP Utilization Among Asian and Pacific Islanders in Greater Los Angeles. American Journal of Health Promotion. 2020;34(7):779-790. doi:10.1177/0890117120925746
- https://www.aafederation.org/nyc-demographic-report/#viz1675364454980; Poverty Tracker Research Group at Columbia University, “The State of Poverty and Disadvantage in New York City.” Robin Hood, Volume 4 (2022) https://www.povertycenter.columbia.edu/nyc-poverty-tracker/2022/the-state-of-poverty-and-disadvantage-in-new-york-city
- Asian American or Native Hawaiian or Pacific Islander
- Annie Kucklick & Lisa Manzer, Overlooked & Undercounted Struggling to Make Ends Meet in New York City 2023 (Center for Women’s Welfare at the University of Washington School of Social Work, 2023), 53