INTRODUCTION
One in six New Yorkers now identify as Asian, reflecting the tremendous growth of the Asian community in our city over the previous ten years. As a result of its sheer size, New York City hosts a wide diversity of Asians, including not just new immigrants from all over Asia, but also those who have lived here for generations. This rapid transformation of our communities brings both new challenges and opportunities. This report provides a fresh new perspective on how our communities are evolving by analyzing demographic data on population, age distribution, immigration and citizenship, educational attainment, English proficiency, employment, income, healthcare insurance coverage, and housing. The goal of this report is to stimulate discussions with elected officials, policy makers, Asian American leaders and individuals that we hope will ultimately lead to policies informed by data and the lived experiences of our communities.
MAP
Note: This map only shows the top population layer if multiple layers are selected at the same time. We suggest leave the boundary layers on and click on only one population layer at a time. Different layers may have different color legends, please click on the arrow next to each layer to show detailed legend.
POPULATION
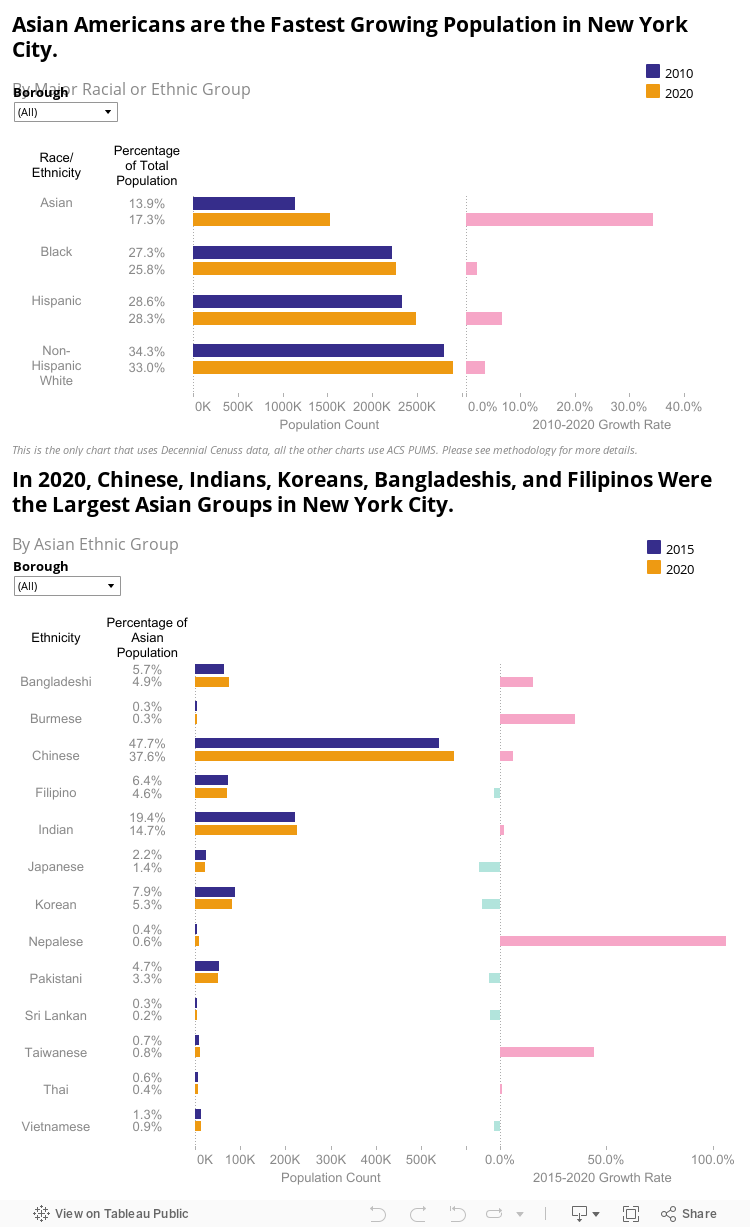
In 2020, there were over 1.5 million Asian Americans living in New York City, accounting for more than 17% of the city’s overall population. Of that number, 46.3% of Asian Americans lived in Queens, followed by 27.4% living in Brooklyn and 16.7% living in Manhattan. Between 2010 and 2020, the Asian American population had the highest growth rate among all major racial or ethnic groups in the city at 34.4%. The Asian American population also grew at the highest rate of all major racial and ethnic groups in all five boroughs: Bronx (38.1%), Brooklyn (47.5%), Manhattan (27.4%), Queens (27.7%), and Staten Island (65.9%).
In 2020, Chinese (573,222), Indians (224,963), Koreans (81,524), Bangladeshis (74,436), and Filipinos (70,116) made up the largest Asian groups in New York City. The Nepalese population grew the most, more than doubling (106.1%) from 2015 to 2020, followed by Taiwanese (44.4%), Burmese (35.4%), and Bangladeshi (15.5%). During the same time period, the Japanese population declined at the highest rate (-9.7%), followed by the Korean (-8.6%) and Pakistani (-5.1%) populations.
Note: While having higher growth rates, Burmese and Nepalese overall have smaller populations compared to the other Asian ethnic groups. See methodology for more detailed definitions of race/ethnicity categories and sources of data.
AGE DISTRIBTUION
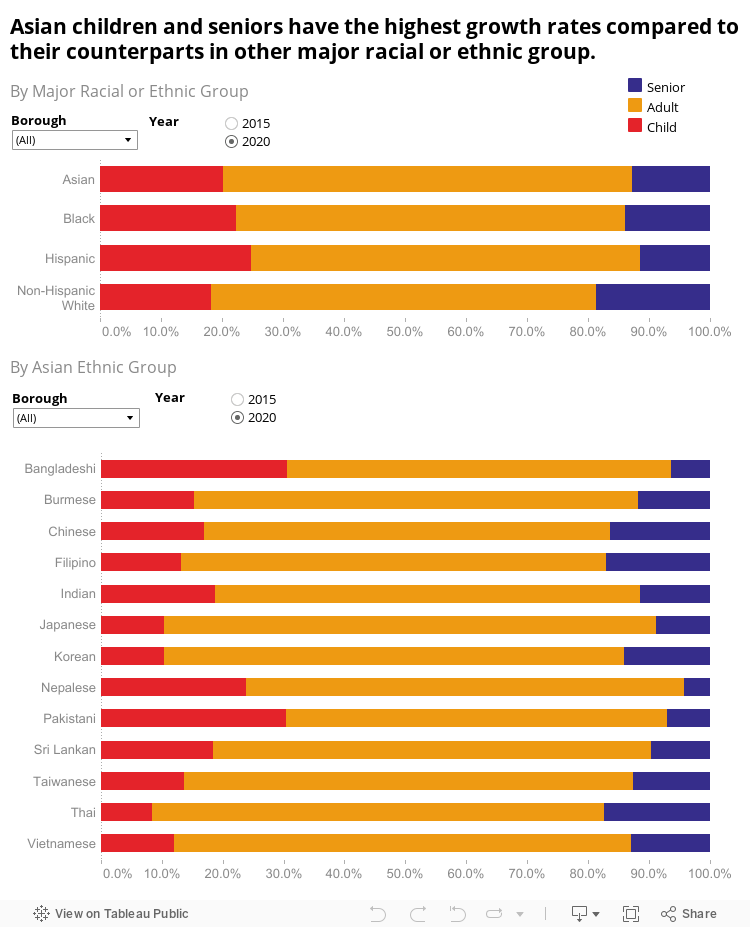
Among the Asian population of New York City in 2020, 20.2% were children, 67.0% were adults, and 12.8% were seniors. From 2015 to 2020, the Asian child population grew from 244,380 to 266,508, while the Asian senior population grew from 125,879 to 168,197. Asian children and seniors had the highest growth rates (9.1% and 33.6% respectively) compared to the corresponding age ranges of other major racial or ethnic groups.
Among Asian ethnic groups, the populations with the highest proportion of children in 2020 were Bangladeshi (30.5%), Pakistani (30.4%), Nepalese (23.9%), Indian (18.9%), and Sri Lankan (18.4%). Between 2015 and 2020, groups with the highest child population growth were Taiwanese (143.4%) and Nepalese (115.0%). In 2020, the populations with the highest proportion of seniors were Thai (17.4%), Filipino (17.0%), Chinese (16.3%), Korean (14.1%), Vietnamese (13.0%), and Taiwanese (12.6%). All Asian groups saw double digit growth for their senior populations, with the exception of the Japanese, who saw their senior population decline (-8.2%).
Note: Children are defined as below 18 years old, adults are defined as between 18-64 years old and seniors are defined as 65 years and above.
IMMIGRATION AND CITIZENSHIP
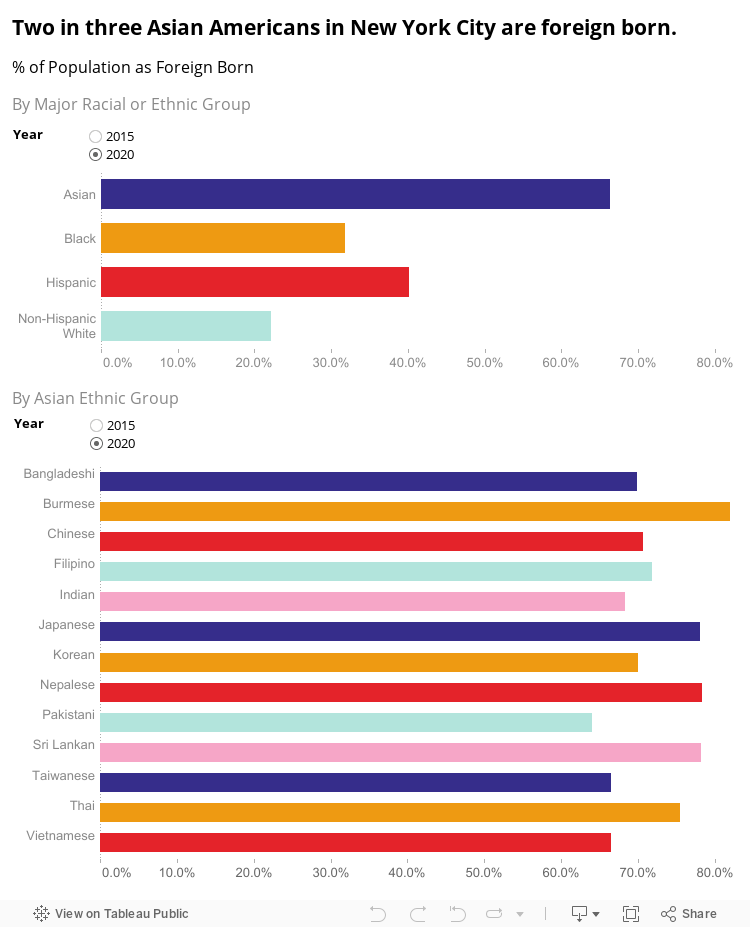
In 2020, 66.3% of Asian Americans in New York City were foreign-born, the highest among all major racial or ethnic groups, but this figure represents a decrease from 69.0% in 2015. Among Asian ethnicities, Burmese had the highest foreign-born rate at 81.9% and Pakistani had the lowest at 64.0%. Most of the groups saw a decrease of their foreign-born proportion from 2015, except Sri Lankan and Thai communities.
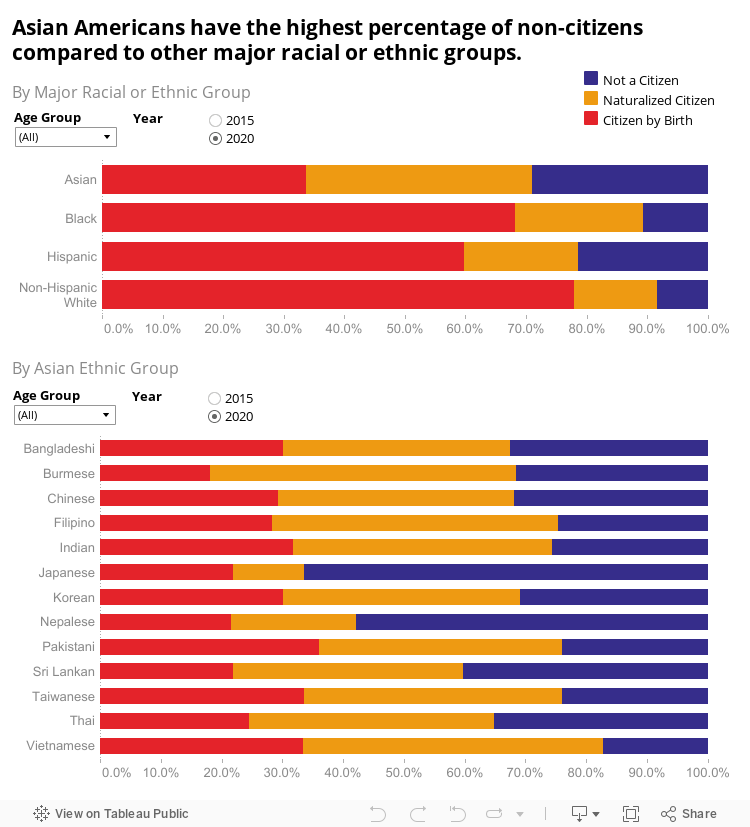
In 2020, 29.0% of Asian Americans in the city were not citizens and 37.4% were naturalized citizens, both percentages being higher than those of their counterparts in other major racial or ethnic groups. Among Asian ethnic groups, Burmese also had the highest percentage of naturalized citizens at 50.4%, and Japanese had the highest percentage of non-citizens at 66.5%.
Note: The foreign-born population includes anyone who is not a U.S citizen at birth, including those who become U.S. citizens through naturalization. The native-born population includes anyone who is a U.S. citizen at birth.
EDUCATION
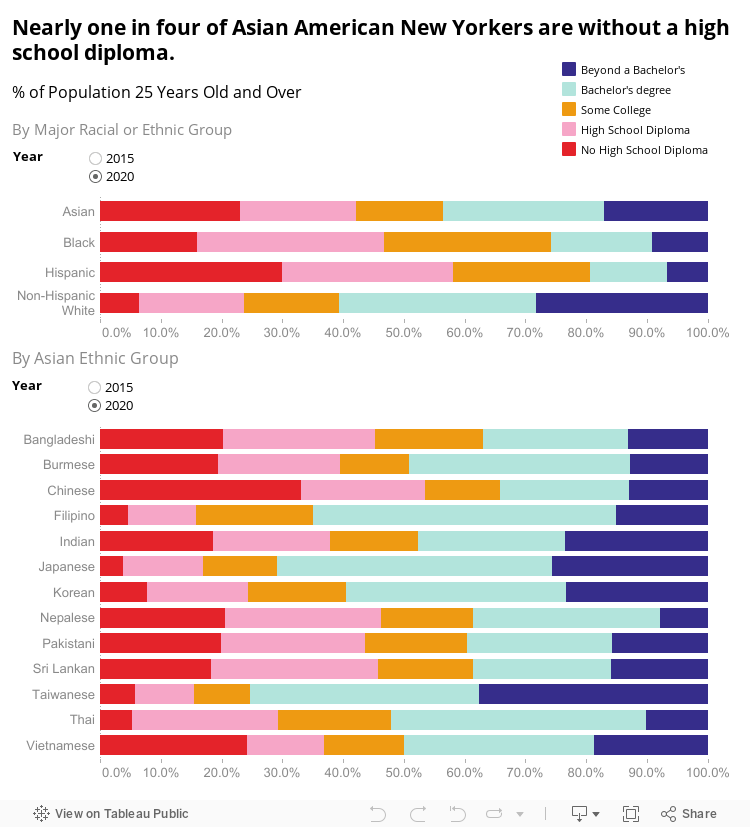
Compared to the other major racial or ethnic groups in New York City in 2020, Asian Americans had the second highest percentage of adults without a high school diploma or equivalent at 23.0%. At the same time, Asian Americans also had the second highest rate of obtaining bachelor’s degree and graduate degrees at 26.5% and 17.1%, respectively.
Among Asian ethnic groups, Chinese had the highest percentage of people without a high school diploma or equivalent at 33.0% in 2020. Filipinos had the highest percentage of individuals with a bachelor’s degree at 49.9%, while Taiwanese had the highest percentage of people with graduate degrees at 37.6%.
ENGLISH PROFICIENCY
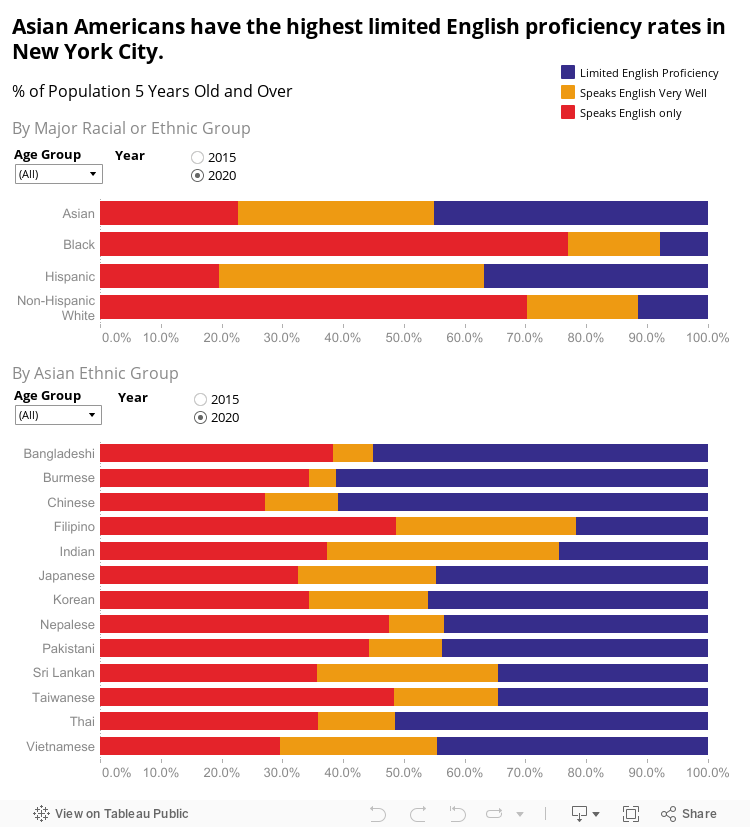
45.0% of the Asian American population over 5 years old had limited English proficiency (LEP) in 2020, which was the highest rate among all the major racial or ethnic groups. The LEP rate for Asian seniors was higher at 72.9%. When broken down into age groups, Asian Americans still had the highest LEP rates when compared to other major racial/ethnic groups for all age groups.
Among Asian ethnic groups, Burmese had the highest LEP rate at 61.2%, followed by Chinese at 60.9%, and Bangladeshi at 55.1%. Among Asian seniors, the majority of the ethnic groups had an LEP rate over 70%, with Nepalese, Taiwanese, and Chinese among the highest.
Note: Limited English proficiency refers to anyone above the age of 5 who reported speaking English less than “very well,” as classified by the U.S. Census Bureau.
EMPLOYMENT
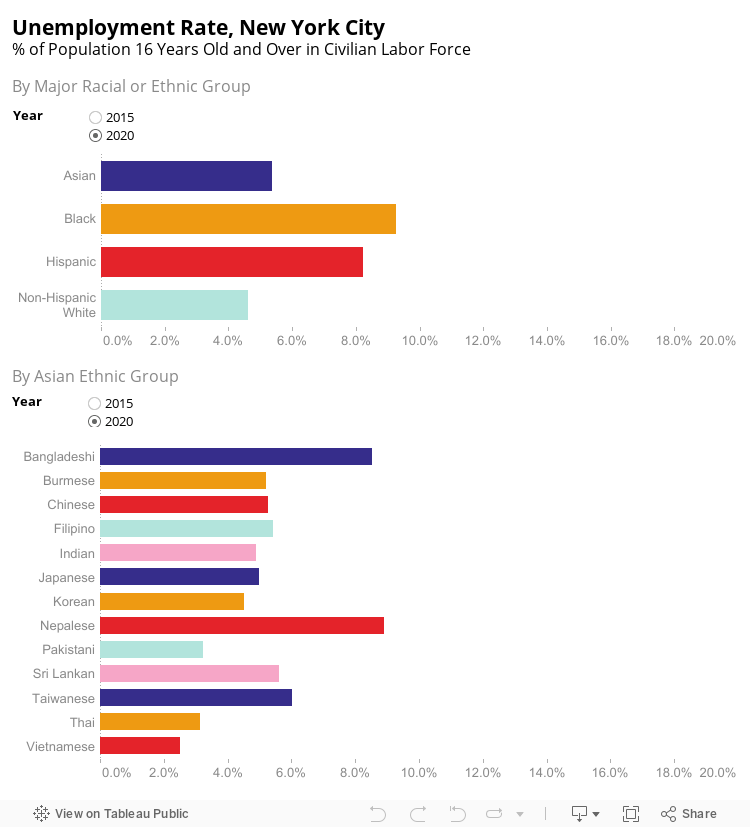
The unemployment rate for Asian Americans in 2020 was 5.4%, the second lowest among major racial or ethnic groups. This was a decline compared to the unemployment rate of 7.3% for Asians in 2015, which was a trend also seen in other major racial or ethnic groups. Among Asian ethnic groups, Nepalese had the highest unemployment rate at 8.9%, followed by Bangladeshi at 8.5%. Most of the groups saw a decline in their unemployment rates from 2015 to 2020, with the exception of Japanese, Sri Lakan, and Taiwanese.
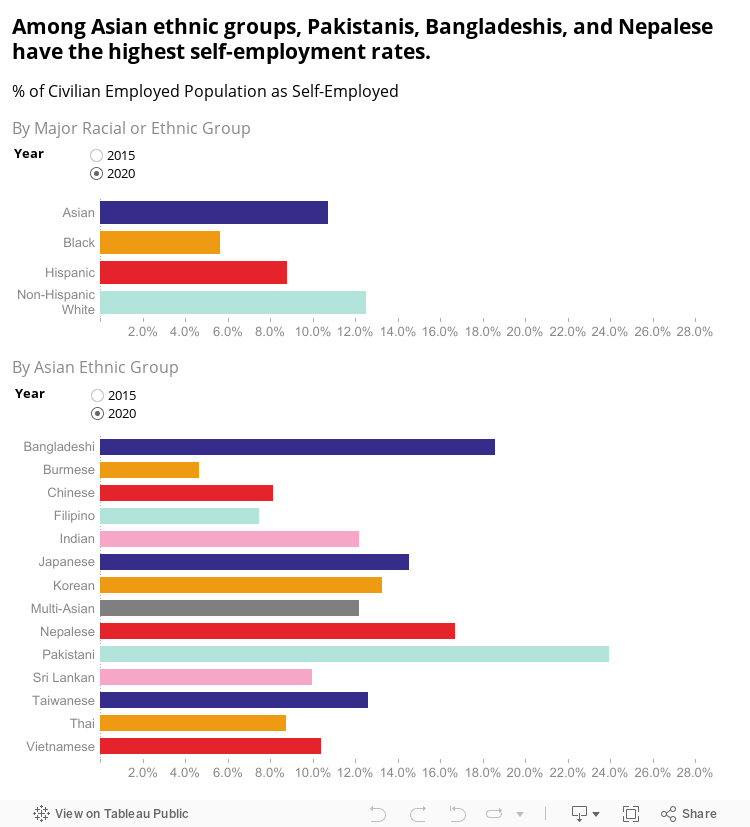
As of 2020, 10.7% of the civilian employed Asian population in the city were self-employed, the second highest among the major racial or ethnic groups. Among Asian ethnic groups, Pakistanis had the highest self-employment rate at 23.9%, followed by Bangladeshis at 18.6%, and Nepalese at 16.7%.
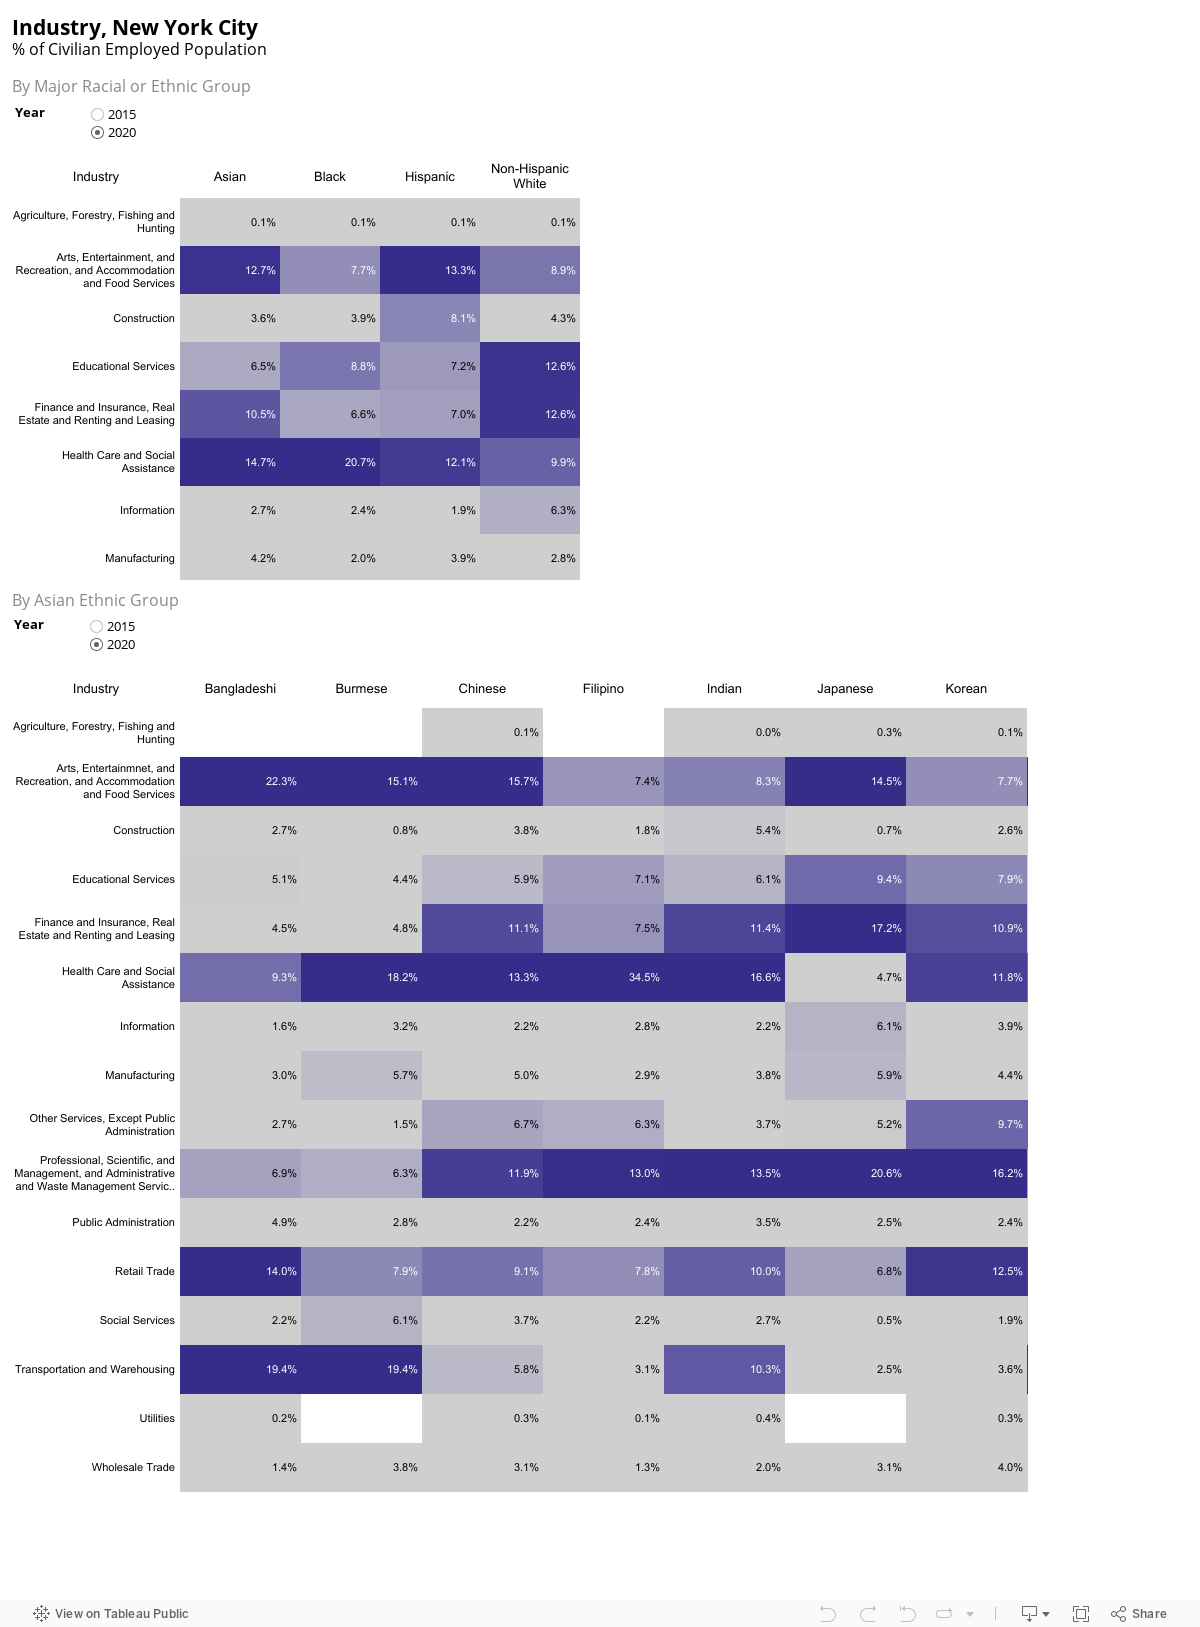
As of 2020, Asian Americans were concentrated in the following five industries: Health Care and Social Assistance (14.7%), Professional, Scientific, Management and Administrative Services (12.8%), Arts, Entertainment and Recreation, Accommodation, and Food Services (12.7%), Finance and Insurance, Real Estate, Renting and Leasing (10.5%), and Retail Trade (9.8%).
This concentration was also reflected in Asian ethnic groups. Bangladeshi, Sri Lankan, and Thai populations had the highest concentration in the Arts, Entertainment and Recreation, Accommodation, and Food Services industry; Chinese, Filipino, and Indian populations had the highest concentration in Health Care and Social Assistance; Japanese, Korean, and Vietnamese populations had the highest concentration in Professional, Scientific, Management and Administrative, and Waste Management Services. Burmese, Nepalese, and Pakistani populations had the highest concentration in Transportation and Warehousing although this industry was not one of the top five industries for Asian Americans as a whole.
INCOME AND POVERTY
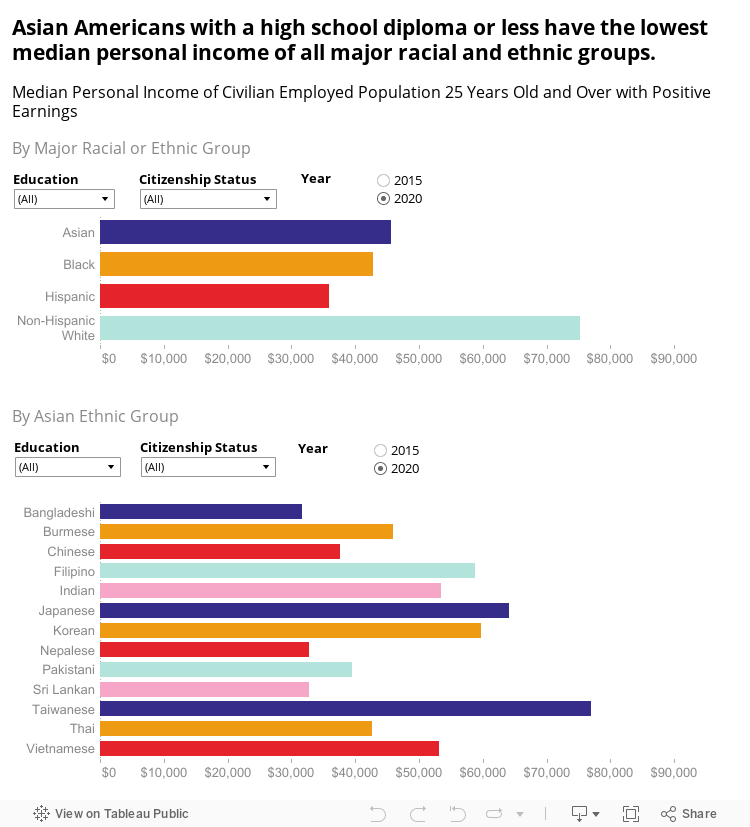
As of 2020, the median personal income for civilian employed Asian Americans over 25 years of age was $45,563, which, when compared to major racial or ethnic groups, was only lower than the median income of non-Hispanic Whites. However, among those with no high school diploma or with only a high school diploma or equivalent, Asian Americans earned $20,928 and $27,133 respectively—less than all other major racial or ethnic groups. Among the Asian American population, those who were not citizens only earned $30,686 compared to $46,234 for naturalized citizens and $71,603 for native citizens in 2020.
The highest-earning Asian ethnic groups were Taiwanese ($76,915), Japanese ($64,122), and Filipino ($58,703), while the lowest-earning groups were Sri Lankan ($32,714), Nepalese ($32,719), and Chinese ($37,601).
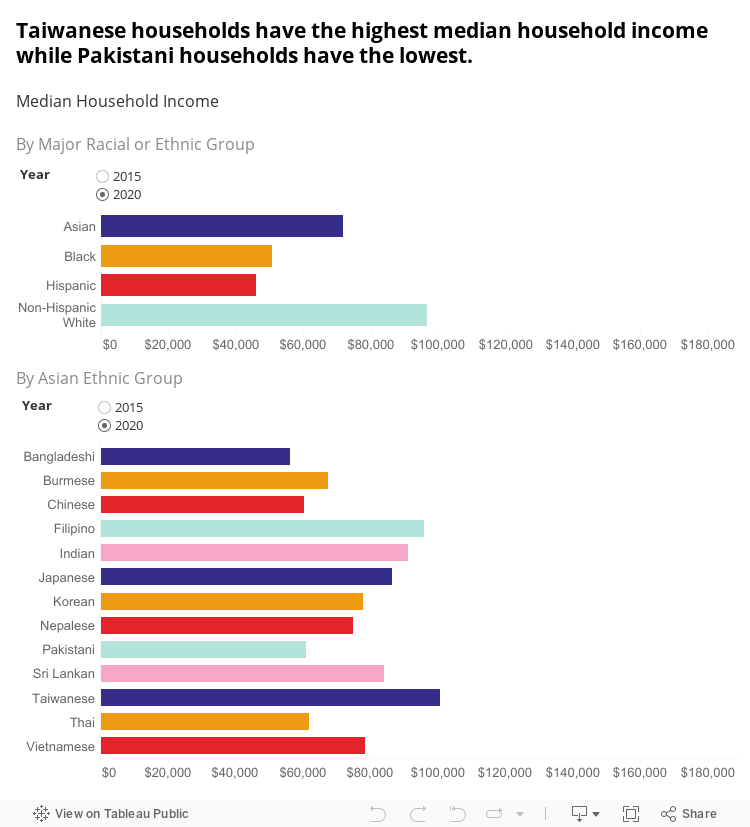
The median household income for Asian households in New York City was $71,753 in 2020. Among Asian ethnic groups, Taiwanese households had the highest median household income at $100,672, while Bangladeshi households had the lowest median household income at $56,282.
Note: Asian households are led by an Asian householder and can consist of non-Asian persons. Similarly, Chinese households are led by a Chinese householder and can consist of non-Chinese persons.
Personal and household incomes are adjusted for inflation.
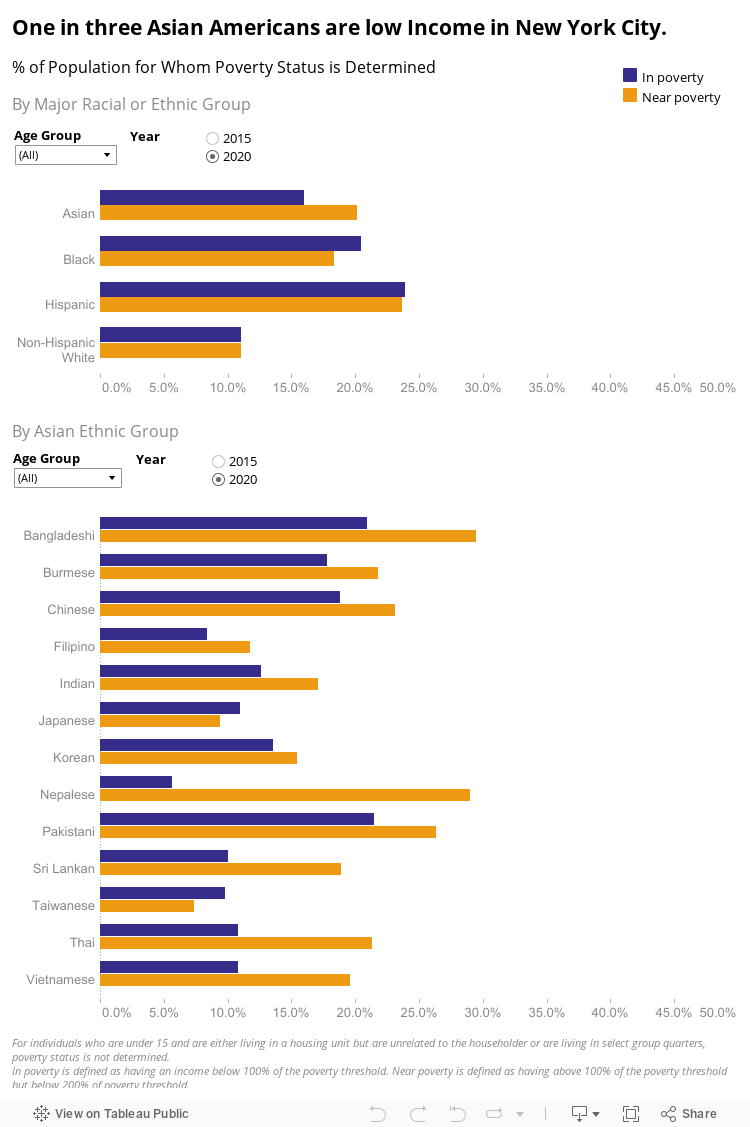
As of 2020, the poverty rate for Asian Americans in New York City was 16.0% and the near poverty rate was 20.2%. Both rates were lower than their counterparts in 2015, a trend identified in all the major racial or ethnic groups. In 2020, Asian seniors had the second highest poverty and near poverty rates compared to other major racial or ethnic groups, at 25.1% and 23.0% respectively, while Asian children also had the second highest near poverty rate at 24.6%.
Among Asian ethnic groups, the city’s Pakistani population had the highest poverty rate at 21.5% in 2020, followed by Bangladeshi at 20.9% and Chinese at 18.8%. The populations with the highest near poverty rates in 2020 were Bangladeshi at 29.4% followed by Nepalese at 29.0% and Pakistani at 26.3%. The poverty rate decreased from 2015 to 2020 for all the Asian ethnic groups except Burmese, while the near poverty rate increased for the Burmese, Filipino, Japanese, Nepalese, Thai, and Vietnamese populations during the same time period.
Note: Poverty is defined as below 100% of the poverty threshold. Near poverty is defined as above 100% but below 200% of the poverty threshold. These two groups are exclusive to each other. Following the Office of Management and Budget’s (OMB) Statistical Policy Directive 14, the Census Bureau uses a set of money income thresholds that vary by family size and composition to determine poverty thresholds. The official poverty thresholds do not vary geographically, but they are updated for inflation using the Consumer Price Index (CPI-U). The official poverty definition uses money income before taxes and does not include capital gains or noncash benefits (such as public housing, Medicaid, and food stamps).
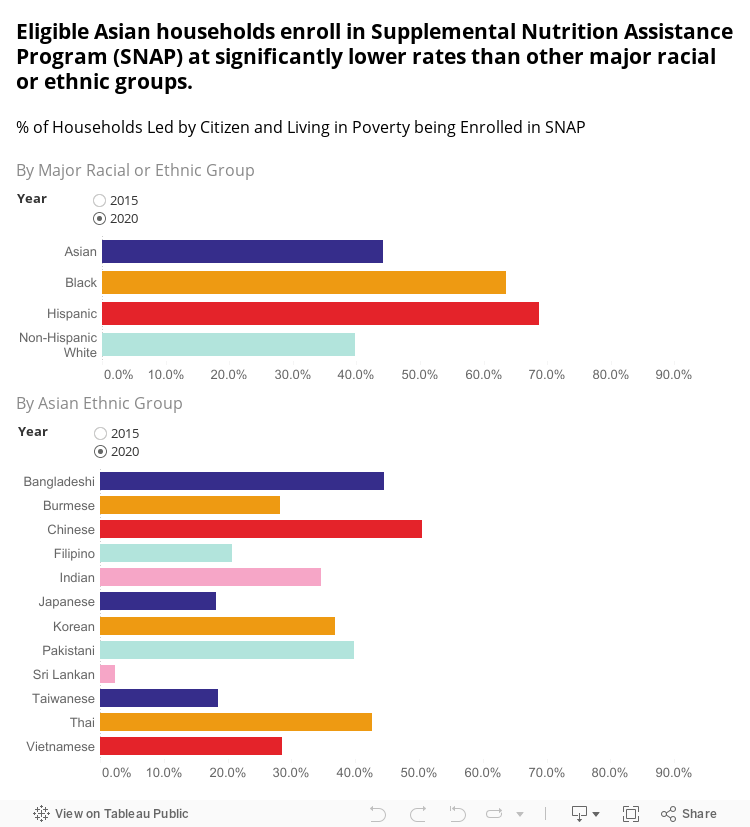
Among Asian households led by citizens and living below the federal poverty level, only 44.2% of them were enrolled in SNAP in 2020, much lower than the 63.5% of Black households and 68.8% of Hispanic households also living below the federal poverty line that were enrolled in SNAP. Among Asian ethnic groups, except for Chinese, Bangladeshi and Thai, the households of all the other groups led by citizens and living under the federal poverty line had less than 40% of their households enrolled in SNAP.
HEALTH INSURANCE
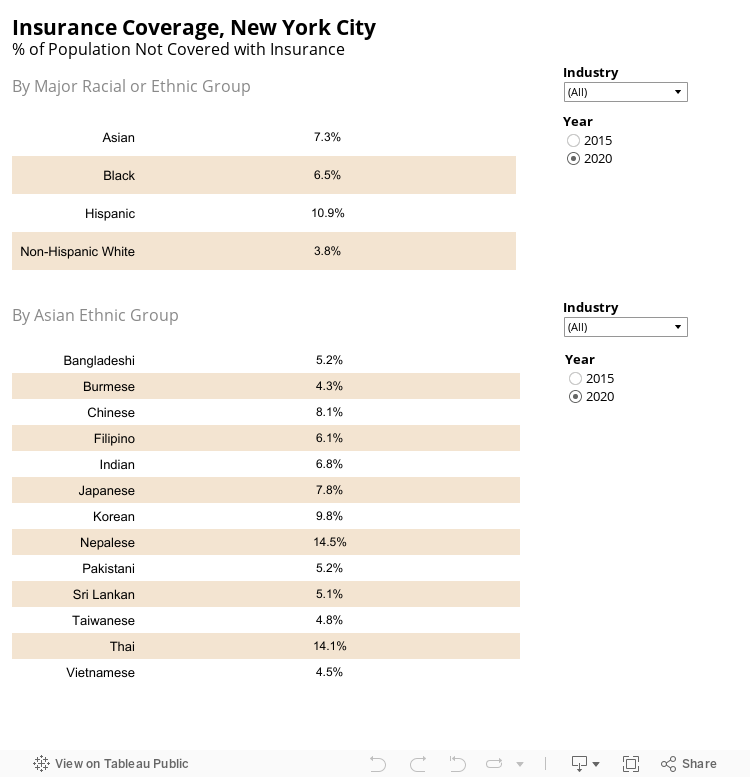
The proportion of uninsured Asian Americans in New York City was nearly cut in half from 14.3% in 2015 to 7.3% in 2020. Nevertheless, these rates were still the second highest among major racial or ethnic groups in both years. The uninsured rates for Asians working in Construction; Other Services, Except Public Administration; Arts, Entertainment, and Recreation; and Accommodation and Food Services were significantly higher than that for the total Asian population, at 18.3%, 17.7%, and 15.7%, respectively in 2020. Among Asian ethnic groups, Nepalese and Thai had the highest rates of being uninsured at 14.5% and 14.1%, respectively.
Note: The 7.3% uninsured rate of Asian Americans includes employed and unemployed. When filtered through industries, the uninsured rate only includes those who are civilian employed. 32.9% of Asian civilians employed in Agriculture, Forestry, Fishing and Hunting were not covered with insurance, the highest among all the industries. However, only 0.1% of employed Asian civilians (16 years and over) worked in this industry in 2020.
HOUSING
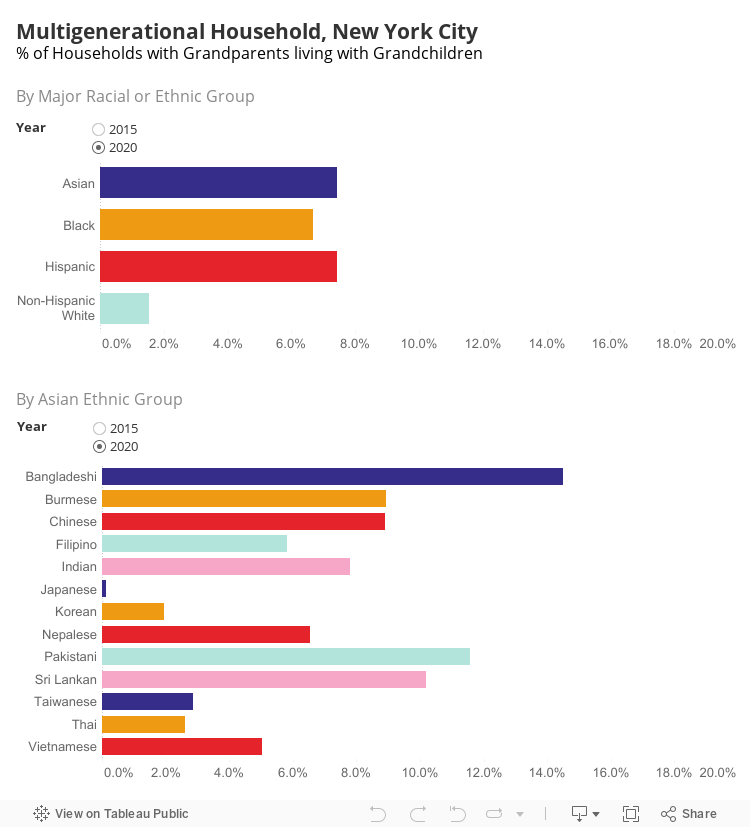
In 2020, 7.4% of Asian households in New York City had grandparents living with their grandchildren, one of the highest multigenerational household rates among the major racial or ethnic groups. Among the Asian ethnic groups, Bangladeshi, Pakistani, and Sri Lankan households had the highest multigenerational household rates at 14.5%, 11.6%, and 10.2%, respectively.
Note: Multigenerational households are defined as including two or more adult generations (with adults mainly ages 25 or older) or a “skipped generation,” which consists of grandparents and their grandchildren younger than 25.
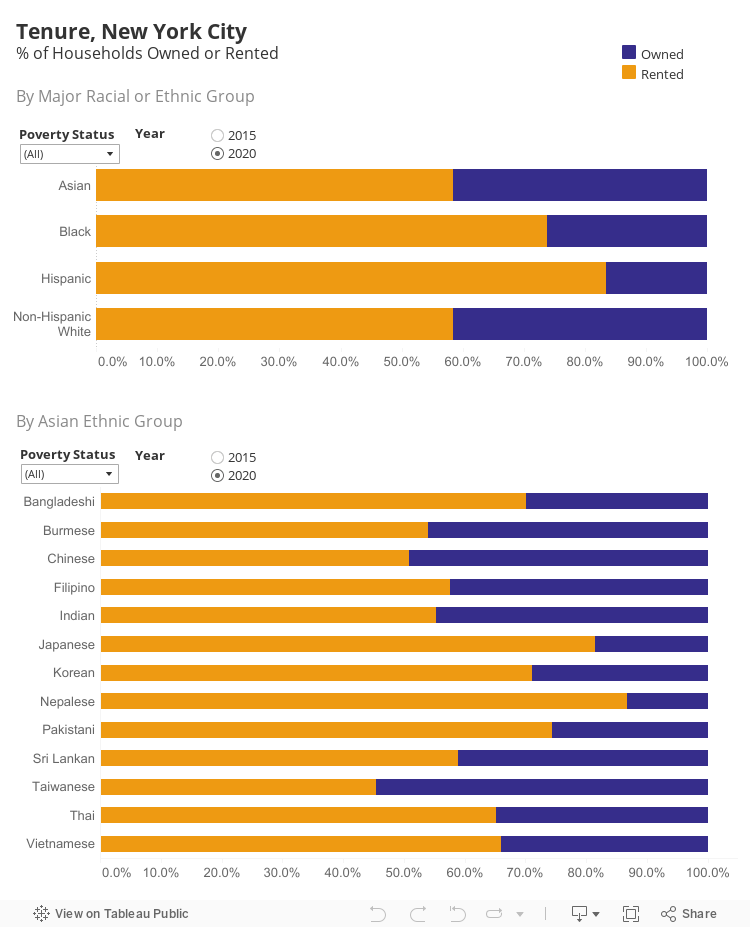
As of 2020, 41.5% of Asian households in New York City owned their homes, one of the highest among the major racial or ethnic groups. However, for Asian households living in poverty, the homeownership rate dropped to 20.9%. Homeownership also varied widely among Asian ethnic groups. While Taiwanese households had the highest homeownership rate at 54.6%, only 13.3% of Nepalese households owned their homes in 2020.
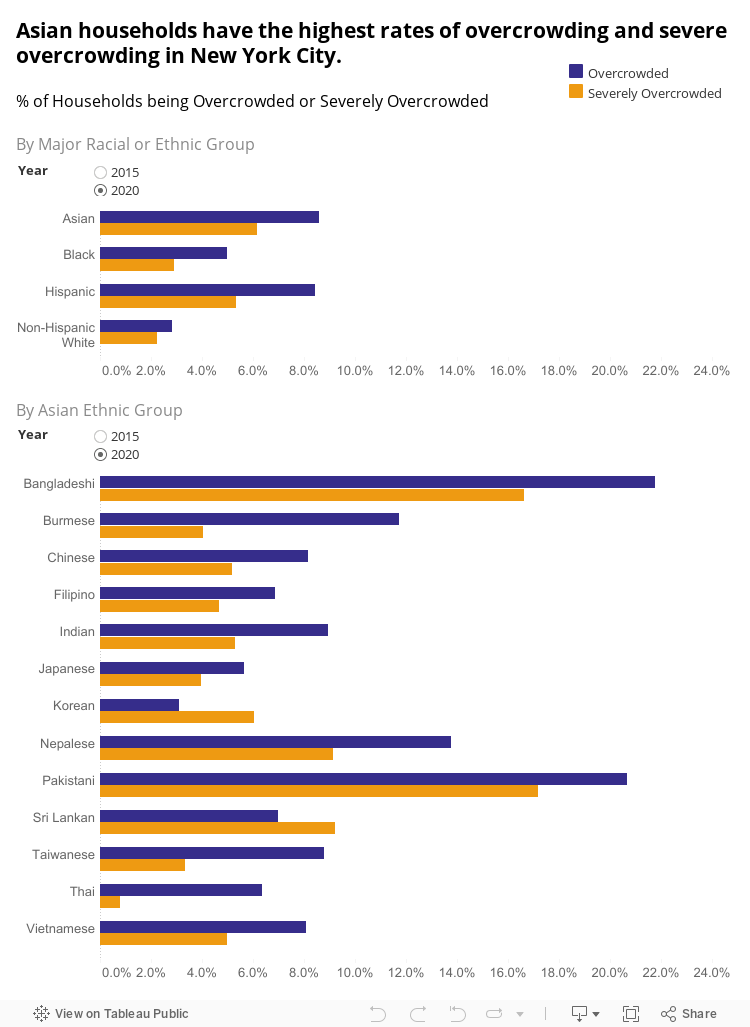
8.6% of the Asian households in New York City were overcrowded and 6.2% were severely overcrowded in 2020. Asian households had the highest rates of overcrowdedness and severe overcrowdedness compared to other major racial or ethnic groups in the city. Among Asian ethnic groups, Bangladeshi households had the highest overcrowding rate at 21.8% and Pakistani households had the highest severely overcrowded rate at 17.1%.
Note: Overcrowding is defined as more than 1 person but less than 1.5 people per room in the housing unit. Severe overcrowding is defined as more than 1.5 people per room in the housing unit. The two groups are exclusive to each other.
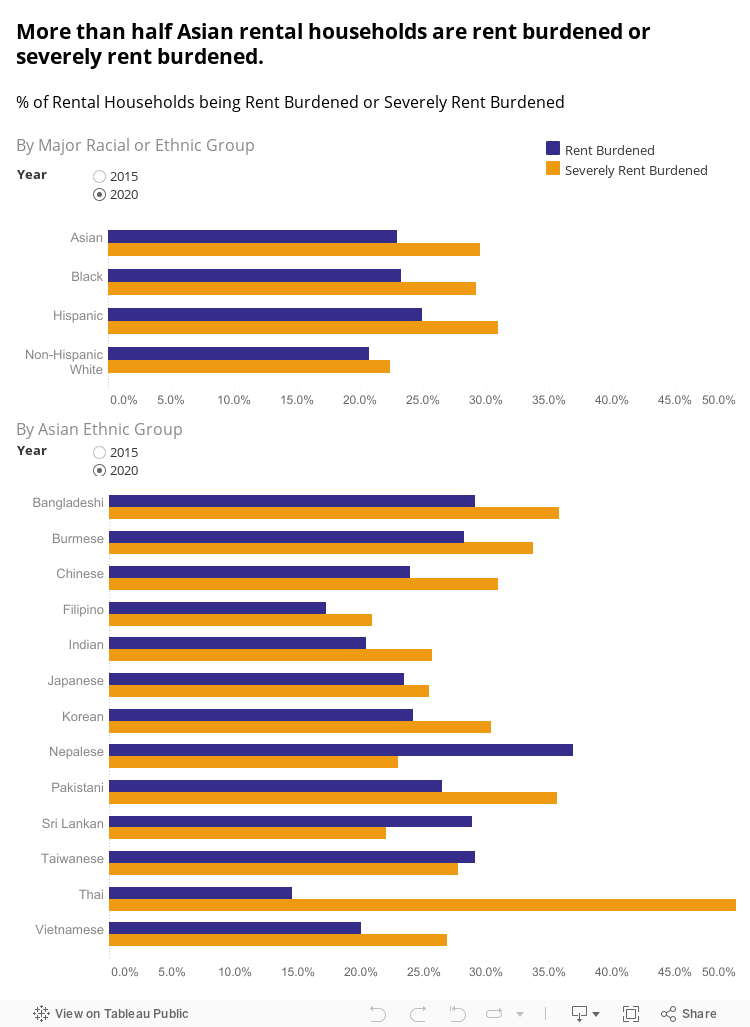
22.9% of the Asian rental households in New York City were rent burdened while 29.5% were severely rent burdened in 2020. Among Asian ethnic groups, Nepalese households bore the highest rent burden rate at 36.9% and Thai had the highest rate of being severely rent burdened at 49.9%.
Note: A household is considered rent burdened if between 30%-50% of household income is spent on gross rent and severely rent burdened if over 50% of household income is spent on gross rent. The two categories are defined as exclusive to each other.
CONCLUSION
390,000 more Asian Americans now live in New York City than they did in 2010, accounting for 17.3% of the city’s population. Asian Americans were the main driver of the city’s overall population growth throughout the last ten years, making up the only significant racial or ethnic group whose number expanded in all five boroughs. While Queens has had the highest percentage of Asian Americans in the last ten years, the Asian American population boom has also significantly changed neighborhoods across the City, from Parkchester in the Bronx to Bensonhurst in Brooklyn, and it continues to significantly reshape New York’s socioeconomic landscape.
Immigrants driving the population growth
The increase in the Asian population is fueled by immigration. Apart from long-established Asian neighborhoods like Chinatown in Manhattan, Sunset Park, and Flushing, immigration has also led to rapid expansion of Asian neighborhoods like Long Island City, Westchester Square, and Ozone Park. As of 2020, immigrants accounted for nearly 80% of the Asian adult population. The Asian population has surpassed the Hispanic population as the biggest major racial or ethnic group of new immigrants—with China, India, and Bangladesh as the leading countries of origin. While the new face of immigration is Asian, the term “Asian” is a catch-all category that masks tremendous diversity, heterogeneity, and inequality.
Asians among the most economically divided major U.S. racial or ethnic groups
This report provides a lens to analyze aggregate “Asian” statistics, to demonstrate the diversity of the Asian American community, and to highlight how the community does not experience education, the labor market, and the economy in the same way. In 2020, the share of adults 25 and over with at least a bachelor’s degree ranged from 75.3% among Taiwanese to 34.2% among Chinese. Median household income ranged from $100,672 among Taiwanese to $56,282 among Bangladeshis, and poverty rates ranged from 29.5% among Pakistanis and 29.4% among Bangladeshis to 5.8% among Nepalese. This disparity in educational levels and incomes is also reflected in the high level of economic inequality among Asians; the top 10% of Asian American earners make around 18 times more than the lowest 10% of Asian American earners. Hence, the Asian American community has become one of the most economically divided major racial or ethnic groups in the City, with those at the lower rungs of the income ladder trailing behind in terms of economic opportunity, mobility, and political influence.
Seniors being left behind
The Asian American senior population grew from 125,879 to 168,197 from 2015 to 2020, representing a 33.6% growth rate: the highest among all major racial or ethnic groups. However, in 2020, the Asian American senior population was faring worse socioeconomically compared to their counterparts in other major racial or ethnic groups. As of 2020, more than 24.2% of the Asian senior population lived in poverty and was the only major racial or ethnic senior group to experience an increase in poverty from 2015 to 2020. Poverty rates also ranged significantly among Asian ethnic groups with 30.5% of Chinese seniors living below the federal poverty level compared to 7.5% of Thai seniors. In 2020, 72.9% of the Asian American seniors had limited English proficiency (LEP). In fact, most Asian ethnic groups had more than 70% of their seniors with LEP. Limited English proficiency, which often correlates with social isolation and inadequate community outreach, often prevents Asian American seniors from accessing social services and thus leaves them out of conversations about the Asian American community.
Workers concentrated in industries and classes hit harder by COVID-19:
This report uses the 2020 American Community Survey 5-year data, which is limited to data from 2016 to 2020, and therefore does not fully reflect the impact of COVID-19. However, it is clear that Asian workers are concentrated in service industries that were hit the earliest and hardest by the pandemic. For example, more than 22% of Bangladeshi workers in the City were employed in the accommodation and food service industry and more than 26% of Nepalese workers were employed in the transportation and warehousing industry. A large fraction of workers in these industries lost their jobs during the pandemic. One in three Filipino Americans were employed in the healthcare and social assistance industry, putting them more at risk for COVID-19 exposure. Moreover, over 10% of Asian workers were self-employed in 2020, with Pakistanis and Bangladeshis having the highest self-employment rate at 23.9% and 18.6%, respectively. These populations of self-employed workers have been particularly disrupted by the combined impact of xenophobia and lockdowns. Asian Americans became scapegoats for the spread of the virus, and so Asian-owned businesses in the city were among the first to suffer declines in business and many had to shutter their storefronts permanently.
Impact of high housing costs on Asian Americans in NYC
As of 2020, 41.6% of Asian households owned the housing unit they lived in. However, households living in poverty or near the federal poverty line were significantly less likely to own homes at 20.9% and 33.4%, respectively. Besides owners, nearly half of Asian American renters in New York City paid more than 30% of their household income for rent. Asian American households faced another unique challenge: the majority of severely rent-burdened Asian American households were also limited English proficient, making it more difficult for them to access housing counseling services. Asian Americans were also more likely to live in multigenerational households, which can lead to overcrowding. As a result, Asian American households had the highest rates of overcrowding and severe overcrowding compared to major racial or ethnic groups. Pakistani, Bangladeshi, and Nepalese households experienced the highest rates of severe overcrowding, at 21.8%, 20.6%, and 13.8%, respectively.