Asian American seniors, immigrants, those with less education, hit hardest by COVID-19 related job losses and poverty in New York City and State
KEY FINDINGS
In both New York City and New York State:
Counting discouraged workers among the unemployed raises the jobless rates for Asian Americans.
Bangladeshi and Nepalese populations had the highest unemployment rates in 2020.
Chinese and Pakistani populations are the poorest among Asian New Yorkers in 2020.
When compared to the other major racial groups, Asian New Yorkers without a high school diploma experienced the greatest increase in unemployment from 2019 to 2020.
Asian American seniors were the only major racial group whose poverty rate increased from 2019 to 2020.
The 2020 American Community Survey (ACS) released by the Census Bureau in January provides an important opportunity for us to take a snapshot at how Asian Americans have struggled with unemployment and poverty during the COVID-19 recession both in New York State and New York City.On aggregate, the Asian American population had lower unemployment and poverty rates than the general population both at the State and the City levels in 2020. However, the Asian American population is diverse with dozens of ethnic subgroups and wide variations in income and educational attainment. Our analysis finds that among Asian Americans, workers without a high school diploma, senior population, and non-citizen immigrants are at greater risk of suffering lasting scars from the pandemic slump.
Note: Due to COVID-19, the Census Bureau faced numerous challenges in collecting information and found significant sampling bias in 2020 ACS data. Read more at the technical notes.
2 of 2
New York City
UNEMPLOYMENT AND JOB LOSS
The unemployment rate in New York City increased from 5.3% in 2019 to 9.9% in 2020. The New York City jobless rate in 2020 was 13.1%. As before, the estimated jobless rates are calculated by adding discouraged workers to unemployed workers.
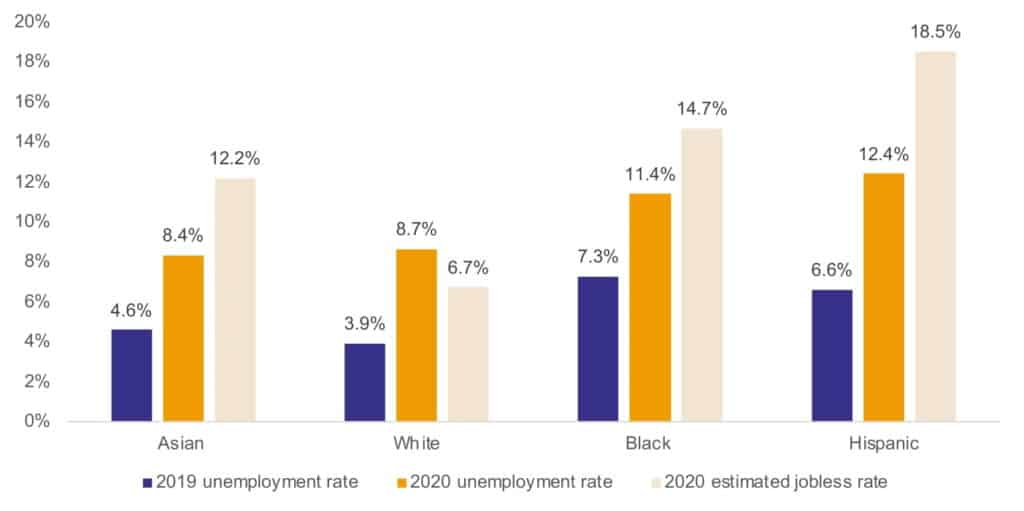
As shown in Figure 8, in New York City, counting discouraged workers among the unemployed raises the jobless rate 3.9 percentage points (from 8.4% to 12.2%) for Asian Americans. This compares to the 3.3 percentage points for Black workers and 6.1 percentage points for Hispanic workers. For White workers, this adjustment shrinks the jobless rate from 8.7% to 6.7%, because there is a decrease in the population that were not in the labor force from 2019 to 2020.
Figure 8. Counting discouraged workers among the unemployed raises the jobless rates for all major racial groups
New York City Unemployment Rates and Jobless Rates
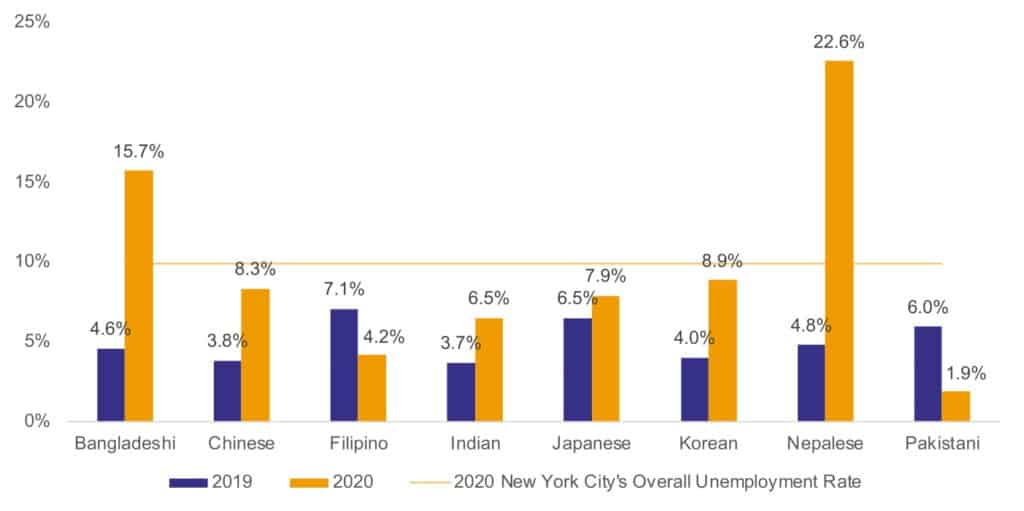
While the unemployment rate of Asian Americans was lower than the City overall rate in 2020, the diverse ethnic subgroups showed wide discrepancies. Among them, the unemployment rates of Nepalese and Bangladeshi workers were the highest among the Asian Americans. As shown in Figure 9, their respective rates were 22.6% and 15.7%, both of which were much higher than New York City’s overall unemployment rate of 9.9% in 2020.
Figure 9. In New York City, Nepali and Bangladeshi populations had the highest unemployment in 2020
New York City Asian American Unemployment Rates
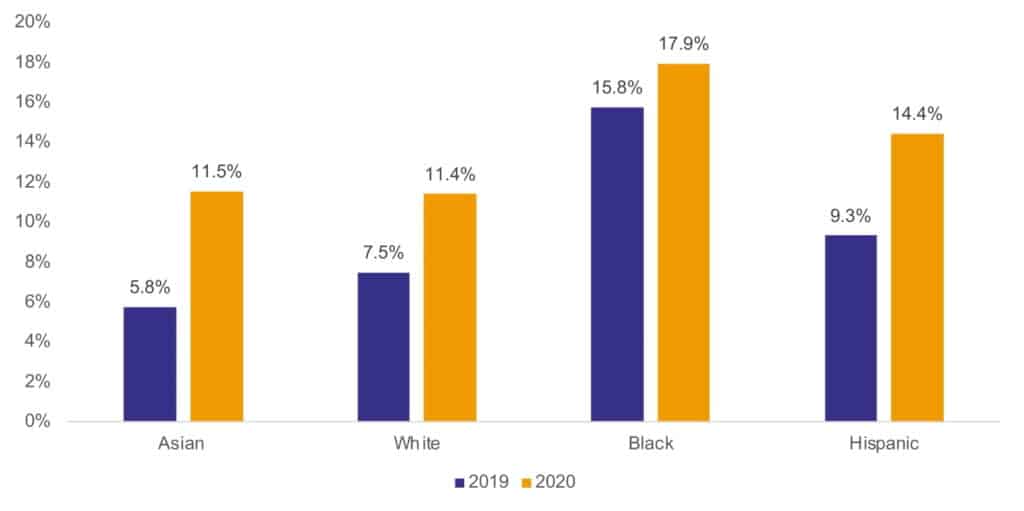
Asian workers with lower levels of education suffered more from the pandemic at the City level too. The unemployment rate of Asian American workers without a high school diploma increased 5.8 percentage points (from 5.8% in 2019 to 11.5% in 2020). This was higher than the respective increases of 3.9 points for White workers, 2.2 points for Black workers and 5.1 points for Hispanic workers (Figure 10).
Figure 10. When compared to the other major racial groups, Asian American workers without a high school diploma experienced the greatest increase in unemployment from 2019 to 2020
New York City Unemployment Rates of Population without a High School Diploma
POVERTY
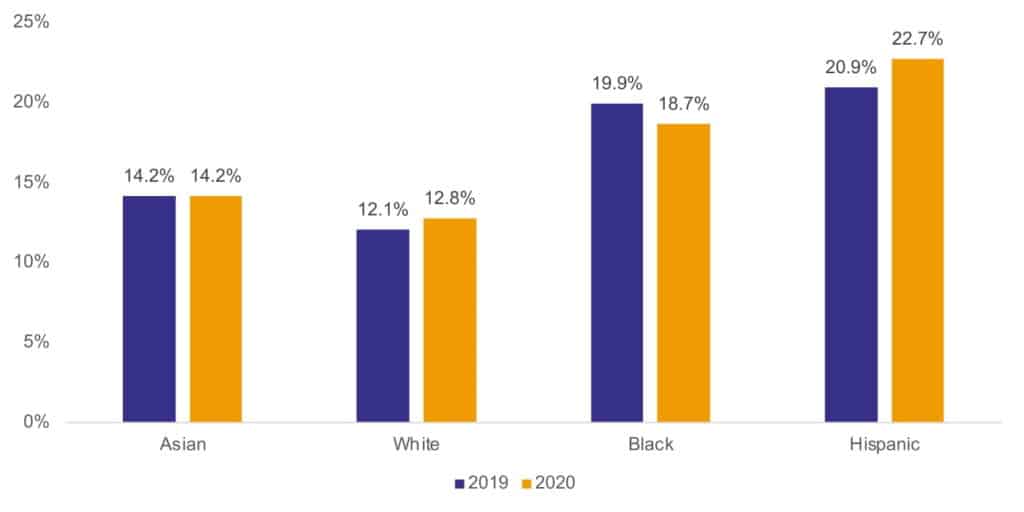
With huge expansion in government aid promoted by the COVID-19, the New York City poverty rate only increased from 15.9% in 2019 to 16.5% in 2020 — much smaller than the spike in the unemployment rate. For Asian Americans, the poverty rate remained at 14.2% from 2019 to 2020 (Figure 11).
Figure 11. New York City’s poverty rate remained steady despite the spike in unemployment rate
New York City Poverty Rates
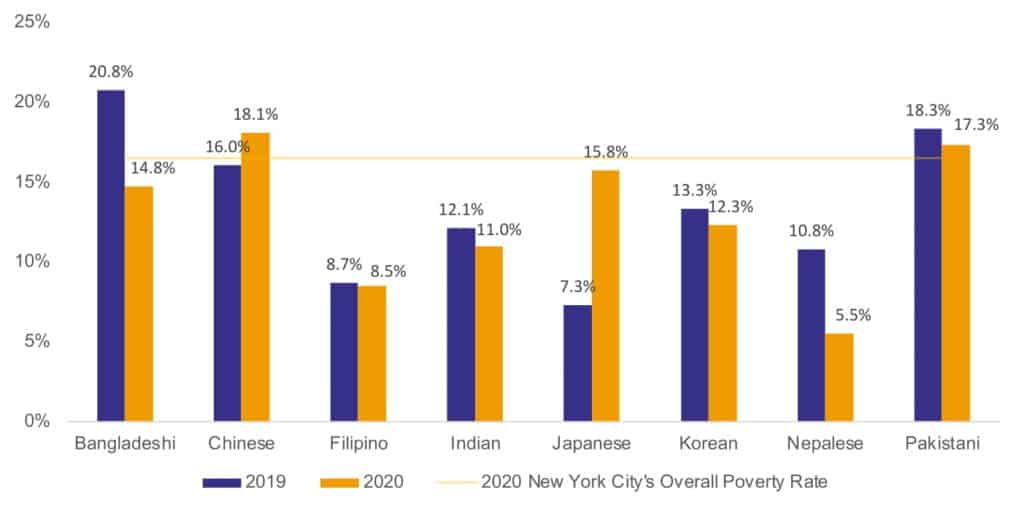
Similar to unemployment rates, the poverty rates varied widely among Asian American ethnic subgroups. In 2020, the poverty rates of Chinese and Pakistani Americans in New York City were the highest at 18.1% and 17.3%, both of which were higher than the City’s overall poverty rate of 16.5%. Bangladeshi, Pakistani and Chinese Americans had the highest poverty rates in 2019. While we see a decline in the poverty rates of Bangladeshi and Pakistani in 2020, Chinese Americans’ poverty rate has increased from 16.0% to 18.1% from 2019 to 2020. The Japanese Americans’ poverty rate witnessed a great increase from 7.3% in 2019 to 15.8% in 2020 (Figure 12).
Figure 12. Chinese and Pakistani Americans were the poorest in NYC even as poverty rates varied widely among Asian Americans in 2020
New York City Asian American Poverty Rates
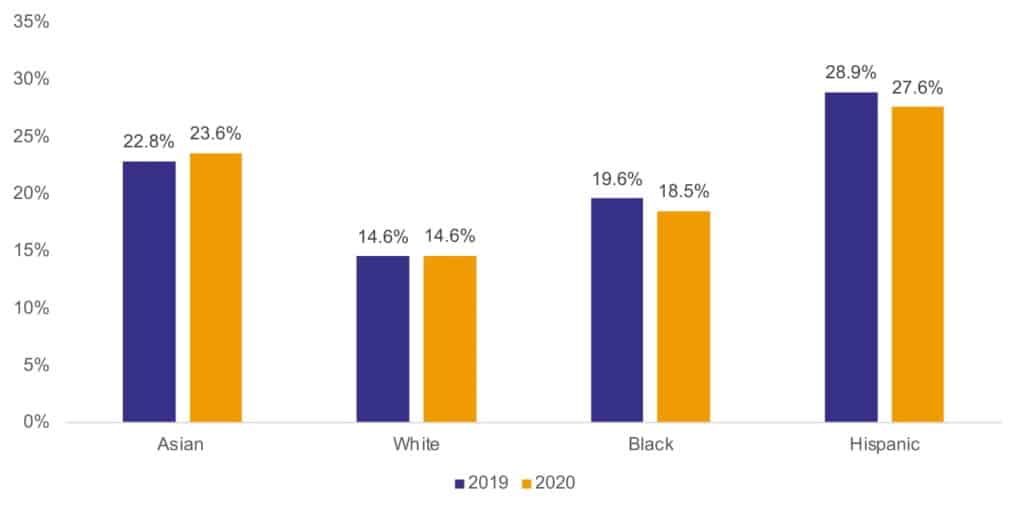
And the pandemic has exposed the economic vulnerability of older Asian adults. As shown in Figure 13, the poverty rates of Asian American senior population were 22.8% in 2019 and 23.6% in 2020, surpassing their White and Black in both years. And Asian American senior population is the only major racial group whose poverty rate increased from 2019 to 2020.
Figure 13. The Asian American senior population was the only major racial group in NYC whose poverty rate increased from 2019 to 2020
New York City Poverty Rates of Senior Population (age 65 and over)
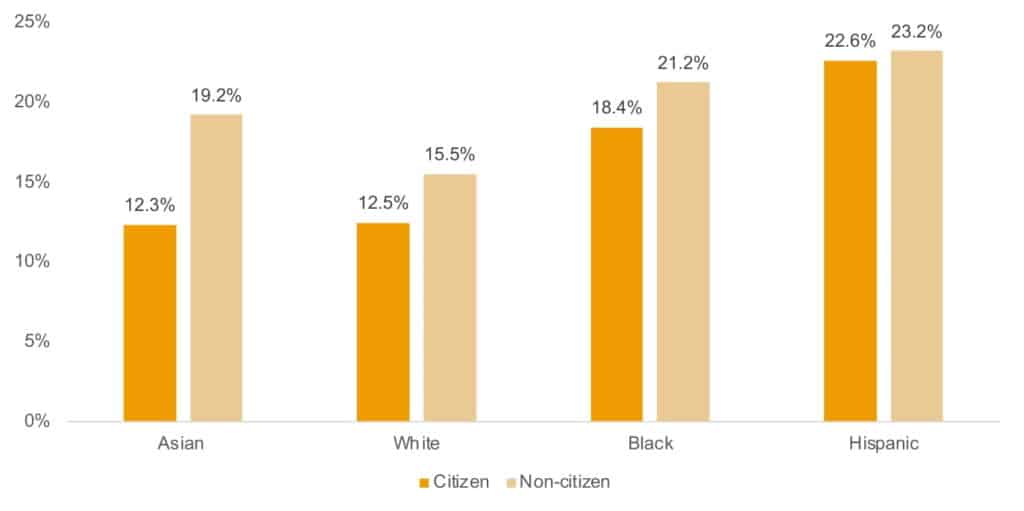
Many Asian American non-citizens have suffered significant economic hardships during COVID-19 recession. Figure 14 depicts the gap between the poverty rates of Asian American citizens and non-citizens — 6.9 percentage points (12.3% for citizens and 19.2% for non-citizens) in 2020. This was bigger than the corresponding differences of the other major race groups – 3.0 percentage points for White, 2.8 percentage points for Black and 0.6 percentage points for Hispanic.
Figure 14. The gap in poverty rates between Asian American citizens and non-citizens in New York City was greater than the gap between the other major racial groups in NYC
New York City Poverty Rates by Citizenship
2 of 2
Technical Notes
- The main data sources for this analysis are 2019 American Community Survey (ACS) 1-year Public Use Microdata Sample (PUMS) and 2020 ACS 1-year PUMS with Experimental Weights. The COVID-19 outbreak has limited in-person data collection and affected the response rate for the 2020 ACS. At face value, the 2020 ACS 1-year PUMS makes it appear that the U.S. population had higher levels of education, had more married couples and fewer never married individuals, had less Medicaid coverage, had higher median household incomes, had fewer non-citizens, and were more likely to live in single-family housing units. In the midst of a pandemic that negatively affected so many lives in 2020, these data show that the respondents were not nationally representative and that the weighting methods did not account for the non-response bias.
- 2020 ACS 1-year PUMS’s experimental weighting procedures can mitigate the effects of nonresponse bias, which occurs when the characteristics of people who complete the survey (respondents) differ from those of people who do not complete the survey (nonrespondents). Nonetheless, the Census Bureau does not recommend comparing the 2020 ACS 1-year experimental estimates with their standard ACS estimates or the decennial census or comparing the 2020 1-year PUMS data with standard pre-tabulated products or PUMS-based estimates from previous years.
- Asian Americans in this analysis refer to the Asian alone or in combination with one or more other racesCensus category which includes anyone who identifies as Asian in any way (White Americans refer to White alone or in combination with one or more other races; Black or African Americans refer to Black alone or in combination with one or more other races; Hispanic Americans refers to a person of Cuban, Mexican, Puerto Rican, South or Central American, or other Spanish culture or origin regardless of race). Beginning in 2020, any data comparisons to prior race estimates should be made with caution, taking into account that the Census Bureau implemented changes to the Race question based on extensive research and outreach over the past decade (for more information how Census improved the way the code what people tell them, please see: https://www.census.gov/newsroom/blogs/random-samplings/2021/08/improvements-to-2020-census-race-hispanic-origin-question-designs.html).
- For our purpose, we define the COVID-19 discouraged workers as those who were in the labor market prior to the health crisis but withdrew during the crisis. (This allows us to not include pre-existing discouraged workers and to focus on the effects of the coronavirus shut down.) This definition is operationalized as the increase in population that is not the labor force from 2019 to 2020. The Bureau of Labor Statistics reports U-4 rate which is the number of jobless workers actively seeking work and discouraged workers as a share of workers either at work, actively seeking work or discouraged from the labor force. We did not use the U-4 rate because it is based on data from the Current Population Survey rather than the 2020 ACS 1-year PUMS.
- The sample sizes of Burmese population in 2020 ACS 1-year PUMS with Experimental Weights are 138 in New York State and 51 in New York City. Due to the small sample size in New York City, we did not include the Burmese population in the city level analysis.